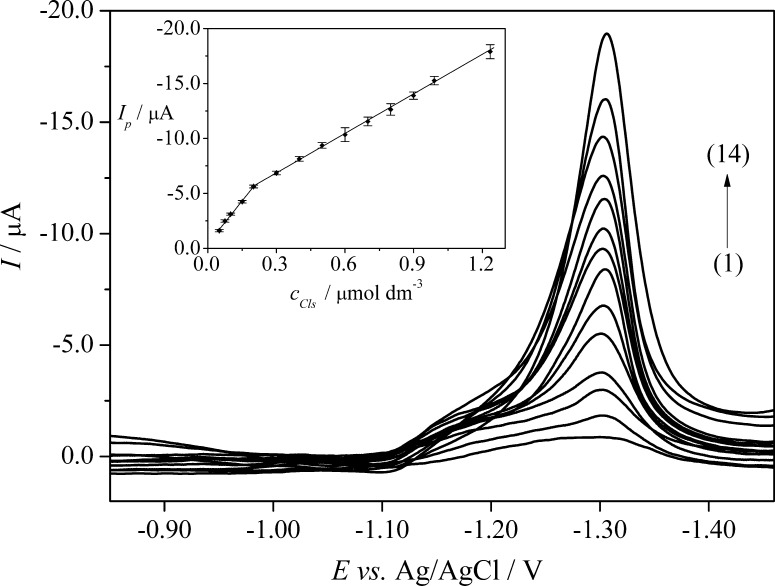
Fig. 5.
SWAdS voltammograms of CLS in B–R buffer, pH 7.0. The inset shows the corresponding calibration graphs; LDR1 (1–5): (1) 5.0 × 10⁻⁸, (2) 7.5 × 10⁻⁸, (3) 1.0 × 10⁻⁷, (4) 1.5 × 10⁻⁷, (5) 2.0 × 10⁻⁷ mol dm−3; LDR2 (5–14): (5) 2.0 × 10⁻⁷, (6) 3.0 × 10⁻⁷, (7) 4.0 × 10⁻⁷, (8) 5.0 × 10⁻⁷, (9) 6.0 × 10⁻⁷, (10) 7.0 × 10⁻⁷, (11) 8.0 × 10⁻⁷, (12) 9.0 × 10⁻⁷, (13) 9.9 × 10⁻⁶, and (14) 1.2 × 10⁻⁶ mol dm−3. The error bars were constructed as confidence intervals (t (p=95%, n=4) = 3.18)

