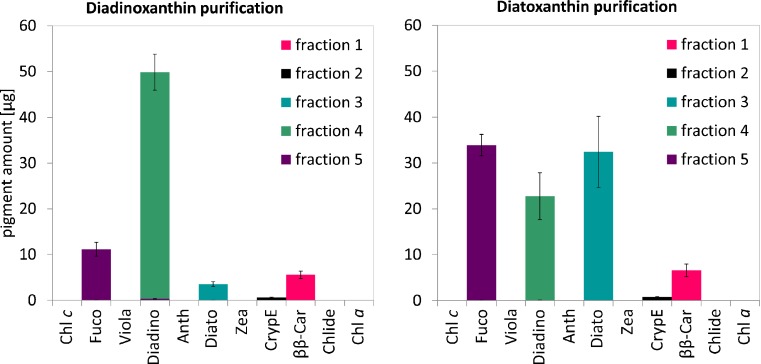
Fig. 5.
The amount of pigments in each fraction collected from the column which was obtained at the end of the purification process of pigments extracted from 2 × 10⁹ cells. Pigment content was determined by HPLC and expressed as an absolute amount. The error bars represent standard deviation (SD). The data are means of four replicates. Statistical data are given in Table A.1 in Supplementary Material

