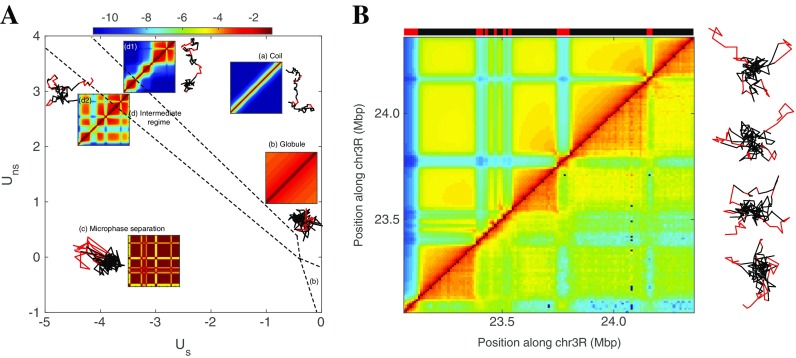
Fig. 4.
The phase diagram of the copolymer framework for modeling epigenome folding. A Phase diagram of the copolymer representing the region located between position 23.06 and 24.36 Mbp of the chromosome 3R as a function of the strength of non-specific U ns and specific U s interaction (in k B T units) when considering the crumpling interaction term. Blocks of the copolymer are built from the (simplified) two-state epigenomic segmentation reported in B and original segmentation and experimental contact map associated to this fragment are reported in Fig. 1c. The phase diagram is obtained by computing the stationary states derived from the GSC approach. Dashed lines represent the resulting continuous transitions between the different phases computed by monitoring the radius of gyration of the whole chain, of single epigenomic domain, or of all the monomers of the same state as a function of parameters (see Jost et al. 2014; Haddad 2016). The grid pitch is 0.2 k B T. Insets represent typical structures and heat maps of the probability of contacts between two monomers (in the same log-unit color-scale) for the different phases: (a) coil (U ns = 3; U s = − 1), (b) globule (U ns = − 0.4; U s = 0), (c) multiphase separation (U ns = 1; U s = − 3.4), and (d) intermediate regime (U ns = 3; U s = − 3.4). B Comparison between the experimental contact map (right bottom) and the best prediction (top left) obtained with U ns = 2 and U s = − 2.6; typical configurations associated with this predicted state are reported on the right

