
Fig. 6.
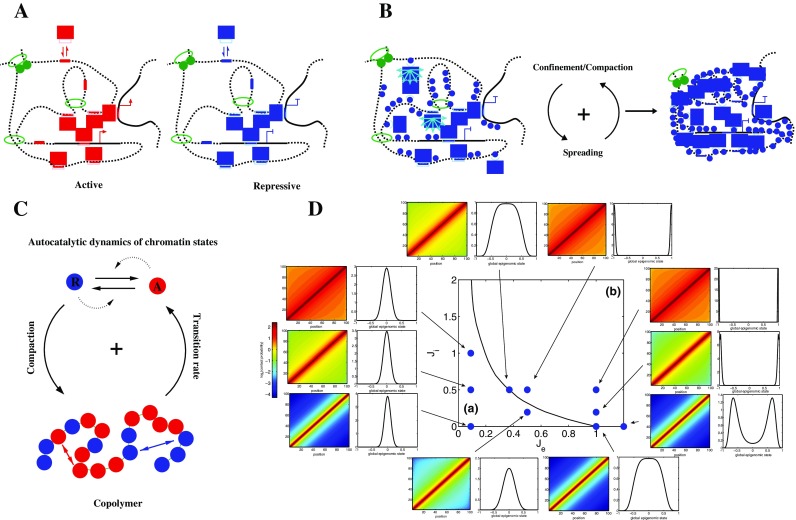
Self-assembly of nanoreactors and the living chromatin model. A The spatial confinement of genomic regulatory sequences such as enhancers (red segments) or silencers (blue segments) result in the increase of the “local” concentration of activators (red rectangles) or repressors (blue rectangles) that are targeted to these sequences; the formation of these active or repressive compartments can result from the self-association between the bound regulators and/or by independent mechanisms such as loop extrusion. B The ability of regulators to both associate with given chromatin markers (blue dots) and propagate these markers in cis and in trans (light blue arrows) provide a robust way of maintaining the functional compartments. C The living chromatin model is a model that combines the copolymer framework (self-attraction between monomer of same chromatin state) and the epigenome dynamics framework (autocatalytic conversion between states); here, as in D, we consider a simple case with two states: repressive (−1) (blue) or active (+1) (red). D Phase diagram of the living chromatin model for a small genomic region as function of the epigenomic-spreading strength J e and of the specific interaction strength J i. The black line separates a region where no global epigenomic state can be defined (a) and a region where a coherent active or inactive state is stabilized (b). For several points of the diagram, we plot the predicted contact probability map (right) and the probability distribution of the global epigenomic state (left) defined as the mean value of e i in the region (∑e i)/N