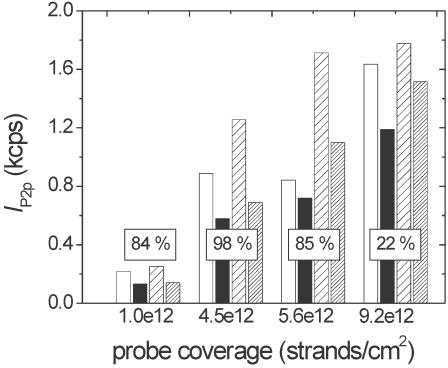
Figure 7.
IP2p intensities measured from P1 probe films initially (white bars), after 15 h immersion in SSC1M buffer (black bars), after 15 h hybridization to TC target (lightly hatched bars) and after 15 h hybridization to TNC target (densely hatched bars). The y-axis is proportional to the total (probe + target) coverage of DNA, with an estimated uncertainty due to emission peak integration of ± 10%. The coverage of probe molecules remaining after 15 h immersion in SSC1M buffer, calculated using Equation 4, is listed along the x-axis for each of the four samples studied. The boxes show percentage of probe molecules hybridized to target strands, as calculated from Equation 3.

