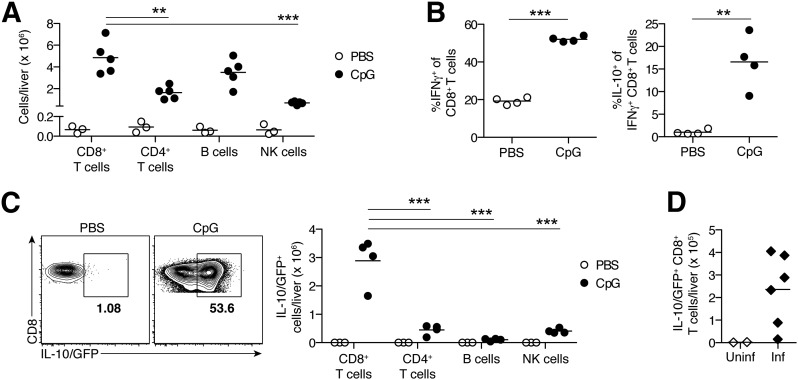
Figure 1. IL-10–producing CD8+ T cells are prominent among hepatic inflammatory infiltrates in murine hemophagocytic syndrome.
(A) Total liver lymphocytes in control (PBS-treated) or TLR9–MAS (CpG-treated) WT mice. n = 3–5 mice/treatment group; data were pooled from 2 independent experiments. (B) Cytokine production capacity of hepatic CD8+ T cells from PBS- or CpG-injected WT mice. n = 4 biologic replicates/group; each obtained from individual TLR9–MAS mice or by pooling cells from 4 PBS-injected mice. (C) Representative flow plots of liver leukocytes isolated from PBS- or CpG-injected IL-10 reporter mice, gated on TCRβ+CD8+CD4− cells. Numbers indicate frequency of IL-10/GFP+ cells among CD8+ T cells. Summary data for total numbers of IL-10/GFP+ cells in livers of PBS- and CpG-injected mice are shown. n = 3–4 mice/treatment group; data were pooled from 2 independent experiments. (D) Numbers of IL-10/GFP+ hepatic CD8+ T cells in uninfected (Uninf) or LCMV-infected (Inf) Prf1−/− IL-10 reporter mice. n = 2–6 mice/group. (A and C) Cell populations within TLR9–MAS mice were analyzed by 1-way ANOVA; significance of Dunnett’s posttests comparing CD8+ T cells to all other groups are indicated. **P < 0.01, ***P < 0.001.

