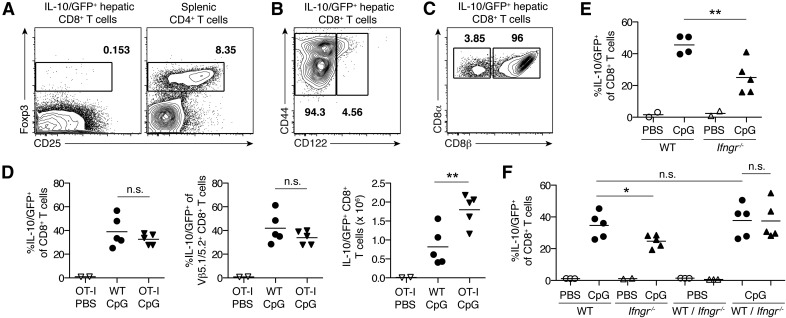
Figure 2. IL-10+ hepatic CD8+ T cells in TLR9–MAS mice are a unique population induced in an IFN-γ–dependent, Ag-independent manner.
(A–C) Representative flow plots of live hepatic CD8+ T cells from TLR9–MAS IL-10 reporter mice. Numbers indicate frequency of cells within the gate. (A) FACS-purified IL-10/GFP+ cells stained for surface CD25 and intracellular Foxp3 expression. Splenic CD4+ T cells from an untreated C57BL/6 mouse are shown for comparison. n = 2 mice/group; data are representative of 2 independent experiments. (B) Flow plot gated on IL-10/GFP+ hepatic CD8+ T cells, showing surface staining of CD122. Representative of n = 4 mice. (C) Flow plot gated on IL-10/GFP+ hepatic CD8+ T cells, showing surface staining of CD8α and CD8β. Representative of n = 2 mice. (D) IL-10 reporter mice with OT-I transgenic TCR (OT-I) or without (WT) received either PBS or CpG to induce TLR9–MAS, without exposure to ovalbumin. Frequency and number of total and Vβ5.1/5.2+ IL-10/GFP+ hepatic CD8+ T cells are shown. n = 2–5 mice/group; data are representative of 2 independent experiments. Analyzed by unpaired Student’s t test. (E) Frequency of IL-10/GFP-expressing hepatic CD8+ T cells in IL-10 reporter mice either sufficient for IFNGR (WT) or deficient (Ifngr−/−). n = 2–5 mice/group; data were pooled from 2 independent experiments. Analyzed by unpaired Student’s t test. (F) BM chimeras reconstituted with cells from IL-10 reporter donors (WT), Ifngr−/− IL-10 reporter donors (Ifngr−/−), or a mixture of both (WT/Ifngr−/−) received either PBS or CpG to induce TLR9-MAS. Frequencies of IL-10/GFP+ hepatic CD8+ T cells among WT cells (circles) and Ifngr−/− cells (triangles) are shown. N = 2-5 mice/group, data are representative of 4 independent experiments. Analyzed by unpaired Student’s t test (WT CpG vs. Ifngr−/− CpG; WT CpG vs. mixWT CpG) or paired Student’s t test (mixWT CpG vs. mixIfngr−/− CpG). n.s., not significant. *P < 0.05, **P < 0.01.

