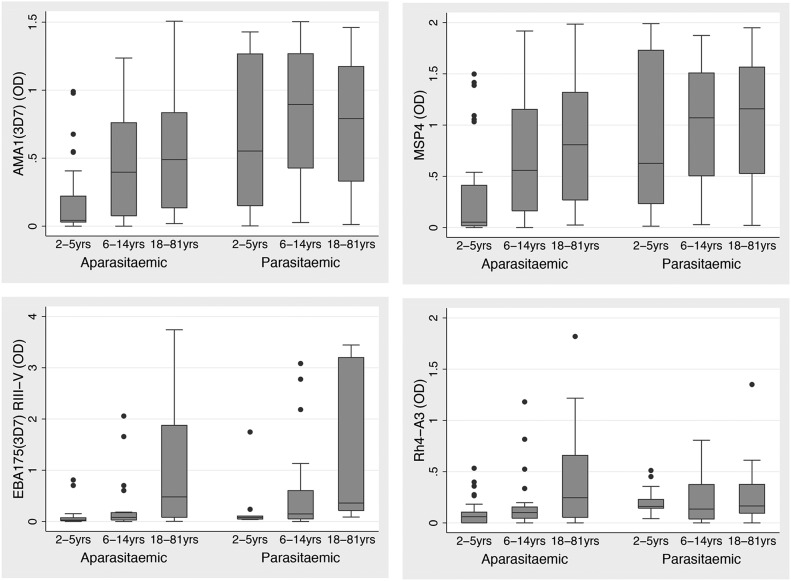
Figure 1. Antibody responses according to age group and parasitemic status in the Ngerenya 1998 cohort for representative merozoite antigens.
IgG was measured by ELISA. Box plots display OD median levels and the IQR. Cohort individuals are separated according to parasitemic status at the time of sampling.

