Fig. 2.

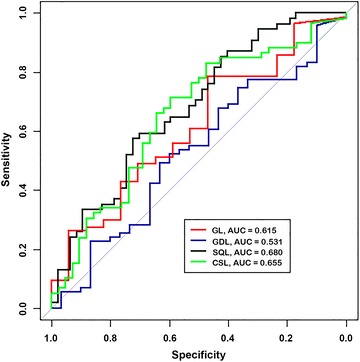
ROC curves for blood sucrose concentration when used to distinguish between normal horses and horses with GL, GDL, SQL and CSL at 90 min after administration of 1 g/kg of sucrose via nasogastric intubation. AUC area under the curve

ROC curves for blood sucrose concentration when used to distinguish between normal horses and horses with GL, GDL, SQL and CSL at 90 min after administration of 1 g/kg of sucrose via nasogastric intubation. AUC area under the curve