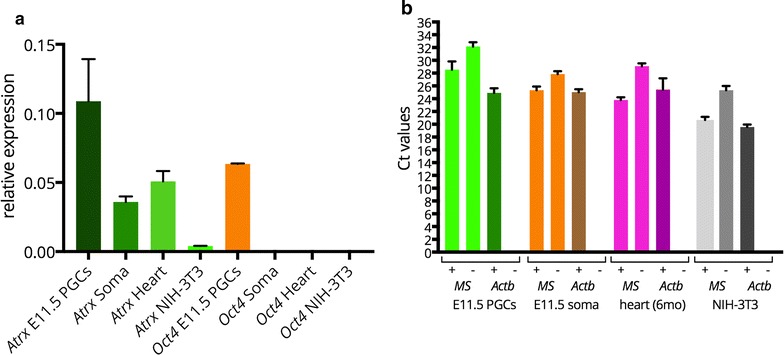
Fig. 10.

Atrx is more highly expressed in E11.5 PGCs compared to the soma, and low major satellite transcription is detected in both cell fractions. a Normalized expression values derived from qRT-PCR of E11.5 sorted OCT4-GFP-positive (E11.5 PGCs) and negative (E11.5 Soma) cells, show that expression of Atrx and Oct4 is higher in PGCs compared to the soma, heart tissue, or NIH-3T3 cells. b Ct values obtained after qRT-PCR [Ct values of + or − RT reactions are shown, whereby no Ct value was obtained for the –RT performed with the Actin (Actb) primers] of major satellites (MS) and Actb in OCT4-GFP-positive (E11.5 PGCs) and negative (E11.5 Soma) cells, heart tissue, and NIH-3T3 cells. The difference between + and − RT reaction is a bit smaller for the E11.5 fractions compared to heart and NIH3T3 cells. Error bars represent standard deviations of two experiments
