
Fig. 5.
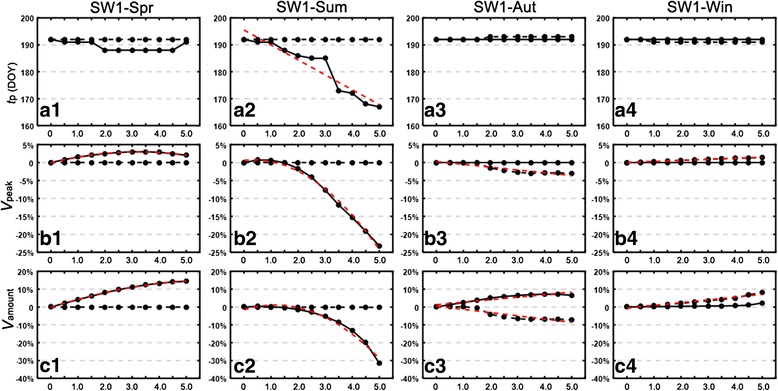
Attributes of blood-fed adult population in Year 2 and Year 3 with respect to ∆T in the four SW1 patterns. The shaded area represents the warming period. The attributes include: peak time (t p) in DOY, percentage change of peak value (V peak) and percentage change of population abundance (V amount)