
Fig. 1.
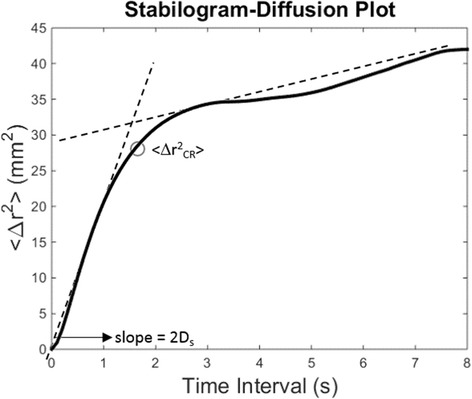
Example of the calculation of Stabilogram Diffusion Analysis features from a diffusion plot. Diffusion plots are characterized by a behavior that can be modeled as two intersecting linear functions. The parameter < Δr2 CR > is calculated as the first negative zero crossing of the derivative of the SDA line. The parameter Ds is calculated as half of the slope of the line best fitting the portion of the curve from 0 to < Δr2 CR>