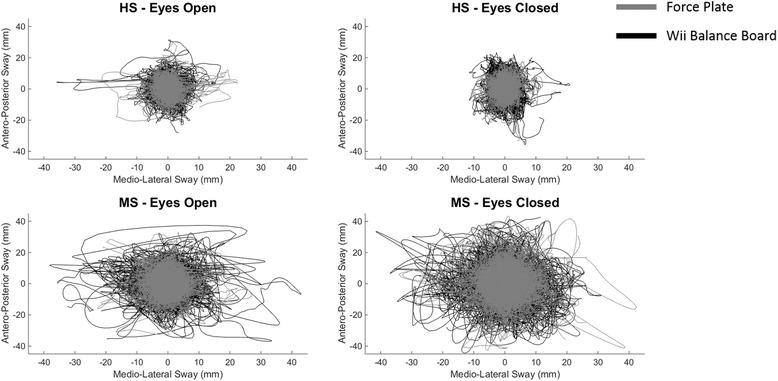
Fig. 2.

Comparison of the stabilograms for each combination of task/population. Each plot presents the superimposed detrended stabilograms for each task of each subject. Grey lines represent COP trajectories obtained from the FP, while black lines represent those obtained from the WBB. Stabilograms obtained from the WBB are generally wider than those obtained from FP. Moreover, while for both the WBB and the FP in HS there are limited differences between the stabilograms relative to eyes-open and eyes-closed conditions, for MS stabilograms relative to the eyes-closed condition are generally more extended than those relative to eyes-open condition
