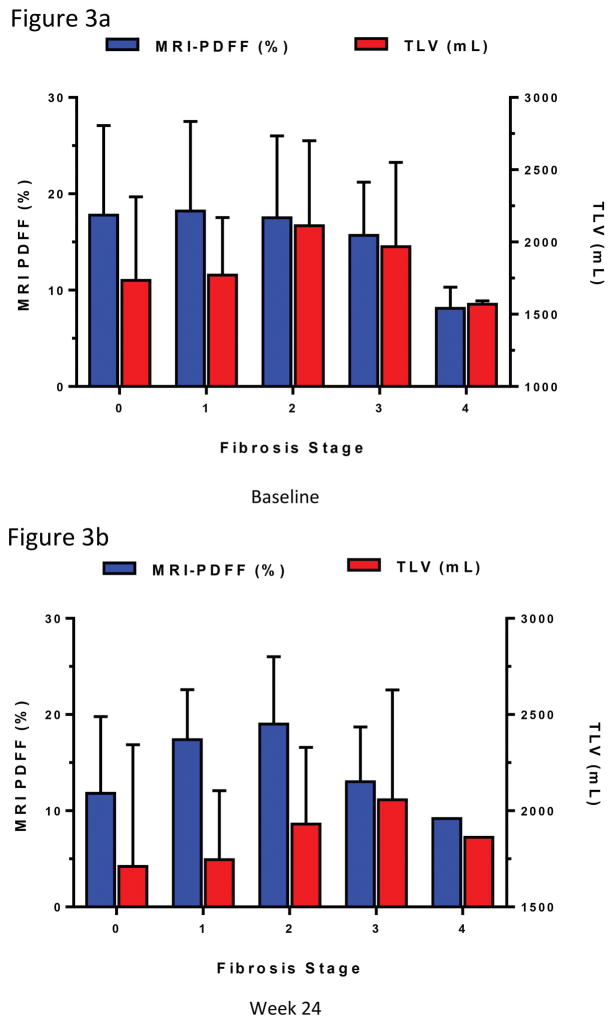
Figure 3. Mean MRI-PDFF and TLV by fibrosis stage at baseline and week 24.
(a) At baseline, mean MRI-PDFF % (±SD) with fibrosis stage 0, 1, 2, 3, 4 were 17.8 (9.3), 18.2 (9.3), 17.5 (8.5), 15.7 (5.5), and 8.1 (2.2), respectively. Mean TLV mL (±SD) were 1733.9 (579.0), 1770.5 (398.9), 2112.4 (588.5), 1967.9 (583.7), and 1569.2 (23.0), respectively. (b) At week 24, the trend was similar. Mean MRI-PDFF (%) with fibrosis stage 0, 1, 2, 3, 4 were 11.8 (8.0), 17.4 (5.2), 19.0 (7.0), 13.0 (5.7), 9.2 (0.0), respectively. Mean TLV (mL) were 1710.8 (632.9), 1745.7 (359.1), 1930.8 (399.1), 2057.4 (570.2), and 1862.2 (0.0), respectively.

