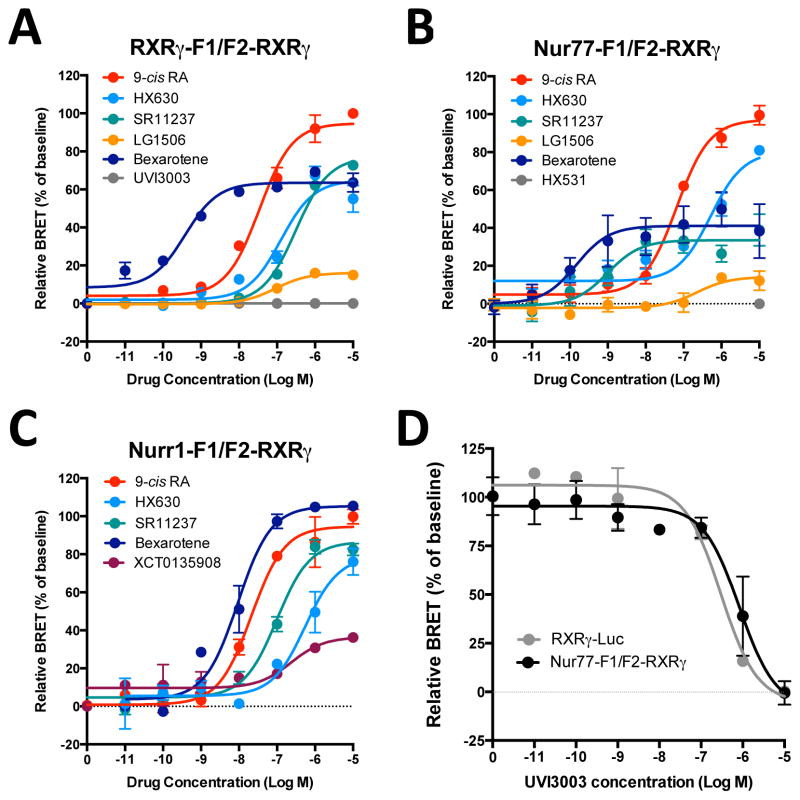
Figure 4. Differential activity of RXR ligands on specific RXR dimeric complexes.
HEK-293T cells were co-transfected with RXRγ-F1 and F2-RXRγ (A), Nur77-F1 and F2-RXRγ (B) or Nurr1-F1 and F2-RXRγ (35 ng for all constructs) (C), and the CoA-YFP construct (30 ng). Cells were treated with increasing concentrations of the indicated RXR ligands for 20 min. BRET signals were measured at 530 nm immediately following addition of coelenterazine H. Data are expressed as percent (%) of basal net BRET signal (relative BRET). Each data point represents means ± SEM of quadruplicate. Each curve is representative of 3–5 independent experiments. Curves were fitted using nonlinear regression analysis to determine 50% effective concentration (EC50) and maximal capacity (Emax) of the compounds (pharmacological parameters can be found in Table 1). (D) For competition curves, HEK-293T cells were co-transfected with RXRγ-Luc or Nur77-F1 and F2-RXRγ, and the CoA-YFP construct. Cells were then treated with increasing concentrations of the RXR antagonist UVI3003 for 20 min in the presence of 9-cis RA at 50 nM. Data are expressed as percent (%) of baseline BRET signal and represent means ± SEM from 3 experiments conducted in quadruplicata. Curves were fitted using nonlinear regression analysis to determine 50% inhibitory concentration (IC50).

