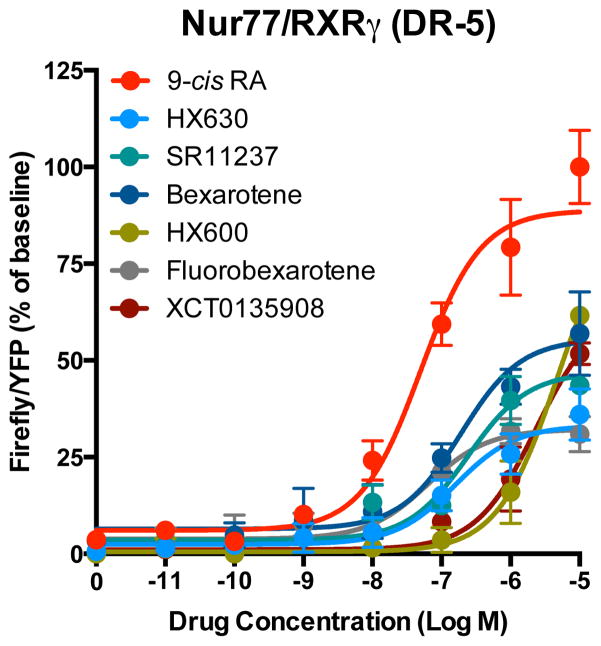
Figure 5. Rexinoid transactivation dose-response curves on a DR-5 element.
Dose-response curves were obtained by exposure to increasing concentrations of rexinoids in a gene reporter assay after co-transfection of Nur77, RXRγ and a reporter gene containing a DR-5 responsive element in HEK-293T cells. Data points represent means ± SEM expressed in percent of baseline Firefly/YFP ratios. These curves are representative of 3–5 independent experiments (pharmacological parameters can be found in Table 2).

