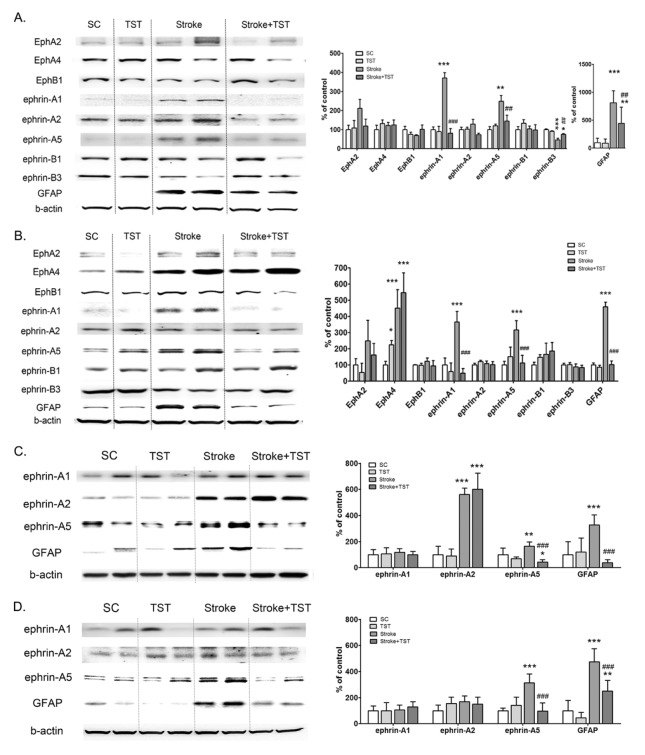
Fig. 2.
Effect of TST for 1 week and 4 weeks on the expression of Eph/ephrin in protein extracts of CST after stroke. Representative photomicrographs of western blots for Eph/ephrin, GFAP, and β-actin in total lysates of the ipsilateral pyramid and spinal cord at1 w (A, B) and 4 w (C, D) after stroke with or without TST initiated at 5 days after stroke. Signal intensities were measured using Quantity One software and are shown as a percentage of control. β-Actin, internal control. Results are presented as the mean ± SD, n =5. **P < 0.01, ***P < 0.001 vs SC; ##P < 0.01, ###P < 0.001 vs Stroke.

