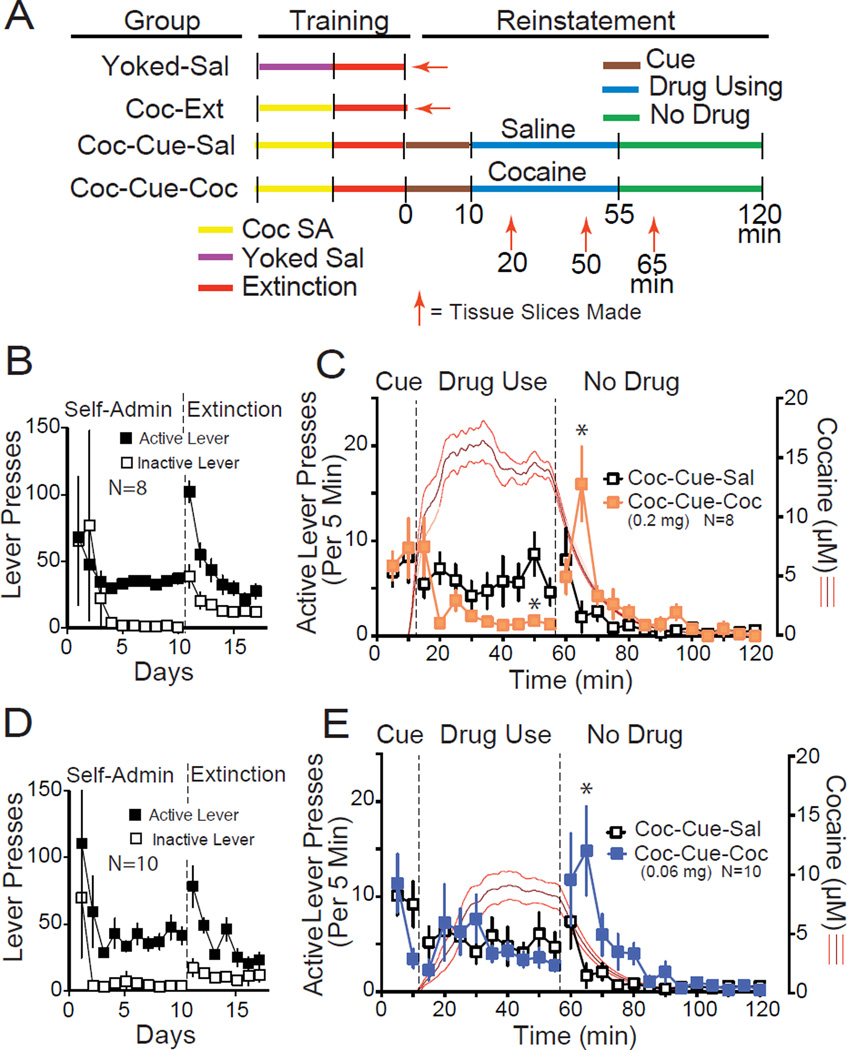
Figure 1. Adapting the cue-induced reinstatement model to assess relapse that includes using cocaine.
(A) Diagram of the experimental time line and all comparison groups used throughout this study. Schematic outlines the modified reinstatement protocol and time points for obtaining slices of NAcore tissue and making measures of t-SP (red arrows). Two control groups did not enter the reinstatement protocol (Yoked-Sal and Coc-Ext), and tissue was obtained 24 h after the last extinction session. Two groups entered the reinstatement protocol. After 10 min of standard cue-induced reinstatement of lever pressing in both groups, either cocaine (Coc-Cue-Coc) or saline (Coc-Cue-Sal) was restored to the active lever, and 45 min later cues and cocaine/saline infusions were discontinued in both groups. SA=period of self-administration. (B) Active and inactive lever pressing during cocaine self-administration and extinction for rats assigned to receive the higher concentration of cocaine (0.2 mg/0.05 ml) during reinstatement. (C) Active lever pressing in 5 min bins over the time course of the protocol in Figure 1A using the 0.2 mg/infusion dose of cocaine (rats were reinstated in a randomized crossover design such that each rat was reinstated with restoration of saline and cocaine on alternate days with ≥2 days of extinction between tests). The red line indicates modeled mean ± SEM concentration of brain cocaine using an algorithm based on animal weight and infusions of cocaine self-administered (16). (D) Active and inactive lever pressing during cocaine self-administration and extinction for rats assigned to receive the lower concentration of cocaine (0.06 mg/0.05 ml) during reinstatement. (E) Active lever pressing in 5 min bins over the time course of the protocol in Fig 1A using the 0.06 mg/infusion dose of cocaine. The red line indicates the modeled mean ± SEM concentration of cocaine.
* p< 0.05 comparing the active lever presses between the Coc-Cue-Sal versus Coc-Cue-Coc, using a Tukey’s post hoc test.

