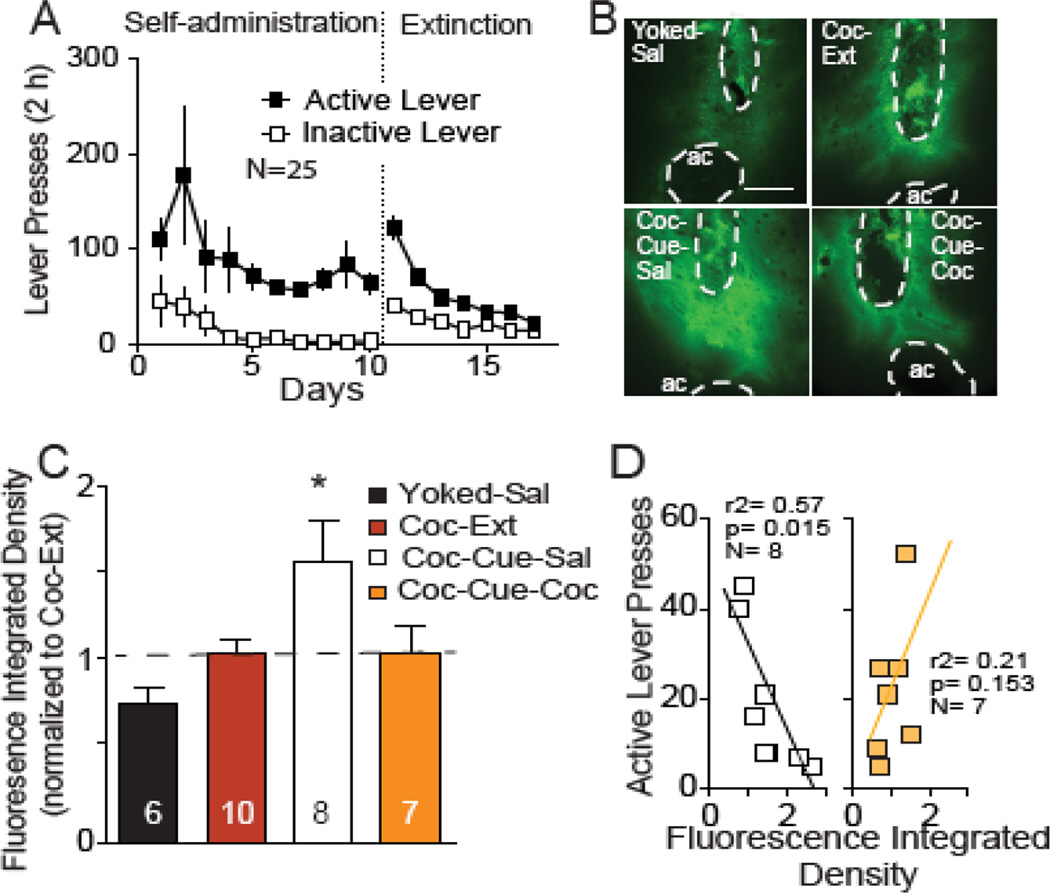
Fig 4. Cocaine access reverses cue-induced increases in MMP-2,9 activity.
(A) Active and inactive lever pressing during self-administration and extinction for rats used to quantify MMP-2,9 activity. (B) Representative examples of FITC-gelatin fluorescence corresponding to MMP-2,9 activity in NAcore from each treatment group. Dashed line outlines the anterior commissure (ac) and injection site that were masked-out for quantification. Bar= 0.5 mm. (C) Increase in MMP-2,9 (mean ± SEM normalized integrated density of fluorescence reported in arbitrary units) after cue-induced reinstatement in animals self-administering saline (Coc-Cue-Sal) was reversed by 10 min cocaine access (Coc-Cue-Coc). Data from 4–6 coronal slices were averaged per rat, and the number in the bar refers to number of rats in each group. (D) Negative correlation between active lever pressing and the integrated density of fluorescence indicative of MMP-2,9 activity in Coc-Cue-Sal animals, but no correlation was found in the Coc-Cue-Coc rats. These data are derived from the data shown in figure 4C and behavior was quantified as described in Figure 2 legend.
*p< 0.05, comparing all groups to extinction baseline (Ext) using a Dunnett’s post hoc test.

