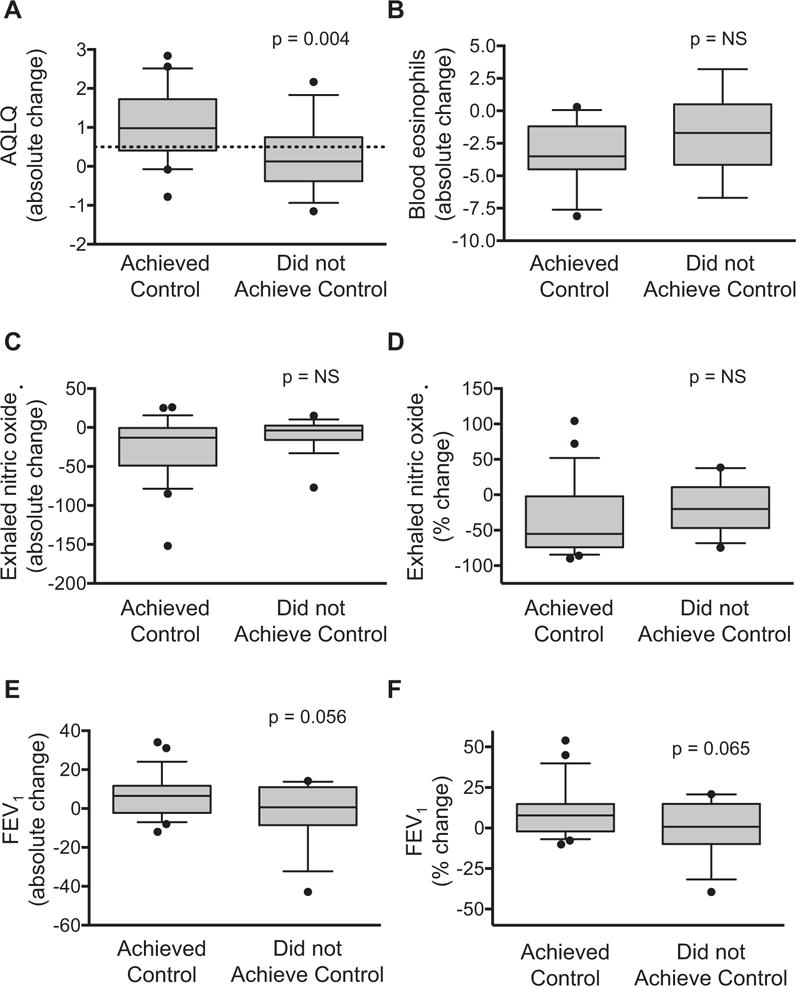
FIGURE 2.

Absolute change in (A) AQLQ scores, (B) blood eosinophils, (C) exhaled nitric oxide, and (D) FEV1 values in children who achieved control versus children who did not. Panels (E) and (F) depict percent change relative to baseline values. Whiskers reflect the 10th to 90th percentile. The dashed line reflects the AQLQ minimally important difference. NS, Not significant.
