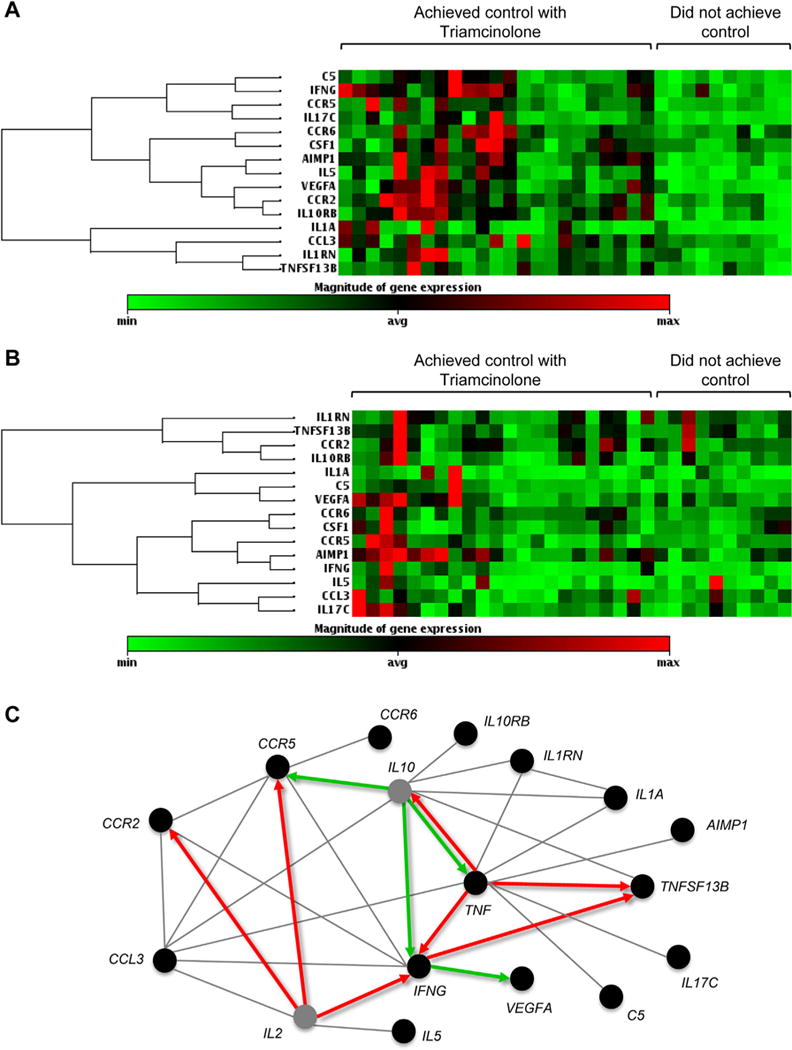
FIGURE 3.

PBMC mRNA gene expression (A) at baseline and (B) after triamcinolone. (C) Pathway analysis of significant genes (P <.05) in children who did not achieve control with triamcinolone (note: TNF, P > .05). Red and green arrows depict upregulation and downregulation, respectively. Gray lines depict reported or probable associations. Gray circles represent genes that were not tested.
