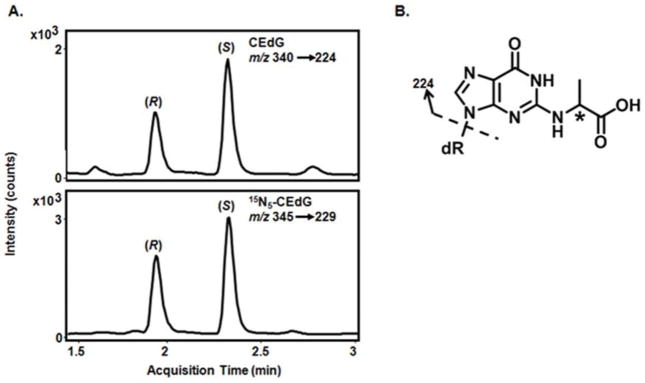
Figure 1. LC-ESI-MS/MS chromatogram of (R, S) CEdG.
A. Representative ion chromatogram of (R, S)-CEdG in urine (top panel) and 15N5-(R, S)-CEdG isotopic standard (bottom panel). Mass transitions used for identification and quantification indicated in the inset. B. Structure of the DNA-AGE CEdG (m/z 340). Dashed arrow indicates the primary fragmentation giving rise to the mass transitions indicated in A. Asterisk (*) indicates the chiral center.

