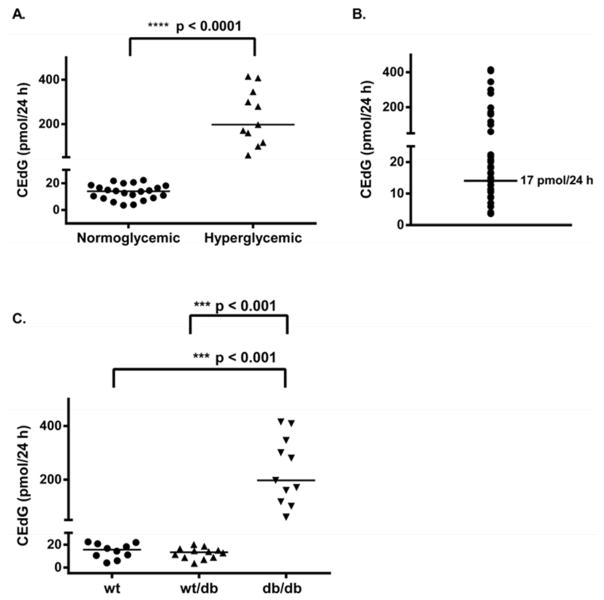
Figure 2. CEdG is elevated as a result of hyperglycemia.
CEdG was quantified as described in Experimental Procedures and time-averaged values (repeated measures analysis) were calculated for each individual animal. A. CEdG levels were compared between normoglycemic (n = 22; FPG < 200 mg/dL) and hyperglycemic (n = 11; FPG ≥ 200 mg/dL) mice. Significance was determined using a non-parametric unpaired t-test. B. Mean CEdG levels were plotted for each animal and the median value was determined to be 17 pmol/24 h. C. Mean CEdG values grouped according to genotype, significance calculated as in A.

