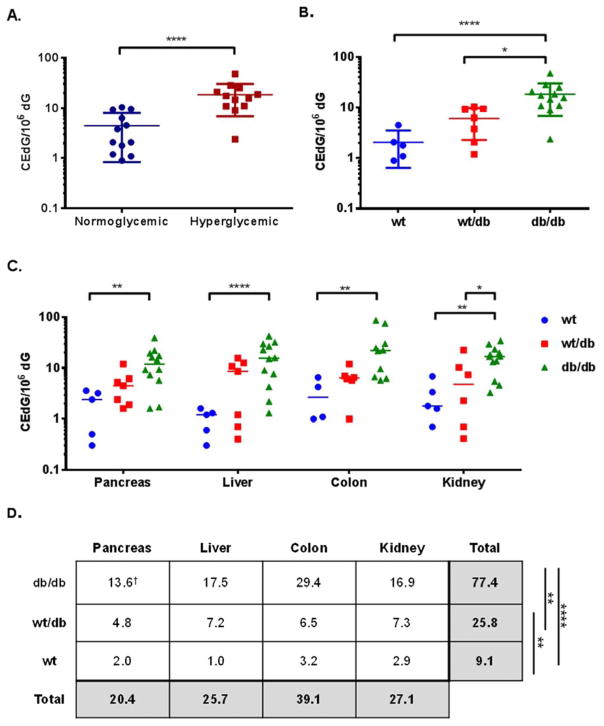
Figure 4. CEdG from tissue is elevated in hyperglycemic and Lepr mutant mice.
DNA was isolated from pancreas, liver, colon, and kidney and analyzed for CEdG as described in Experimental Procedures. CEdG values were averaged across tissues from individual mice and grouped according to A. glycemic status or B. genotype. C. CEdG measurements from pancreas, liver, colon, and kidney from individual mice stratified by genotype. D. One-way ANOVA with Tukey’s modification was used to analyze CEdG differences between genotypes (irrespective of tissue, last column) and between tissue (regardless of genotype, bottom row). †CEdG/106 dG. See text for details. Significance values: *p ≤ 0.05; **p ≤ 0.01; ***p ≤ 0.001; ****p ≤ 0.0001.

