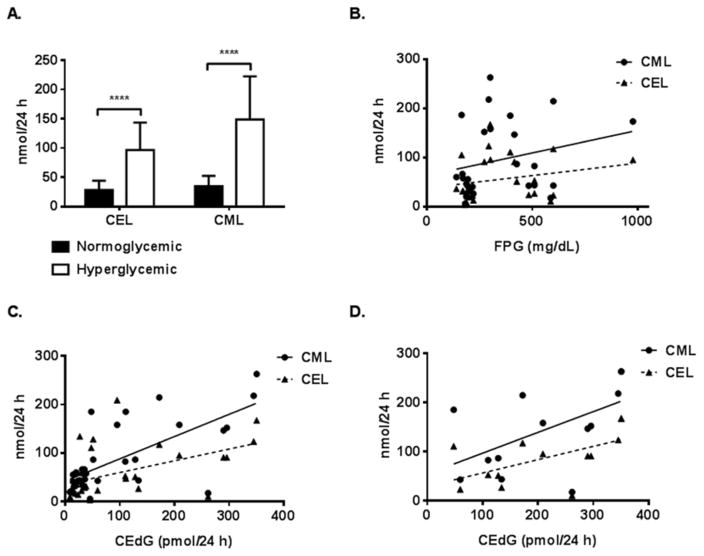
Figure 5. CEL and CML are elevated in urine of hyperglycemic mice and correlate with CEdG.
A. Mean values of CEL and CML measured in urine from aged-matched hyperglycemic and normoglycemic wt (9), wt/db (9), and db/db (11) mice using LC-ESI-MS/MS. FPG was measured at the cessation of 24 h urine collection. Two-way ANOVA revealed a significant increase in CEL and CML in hyperglycemic mice (****p < 0.0001). B. CML (n=32) and CEL (n=32) vs. FPG. No significant correlation was observed. CML, r = 0.2458; CEL, r = 0.2267. C. Plot of CML and CEL vs. CEdG for all mice; CML, r = 0.7009 (****p < 0.0001); CEL, r = 0.4902 (**p = 0.0044). D. CML (n=32) and CEL (n=32) vs. CEdG from hyperglycemic mice; CML, r = 0.5589 (*p = 0.0471); CEL, r = 0.5805 (*p = 0.0375).

