Figure 6.

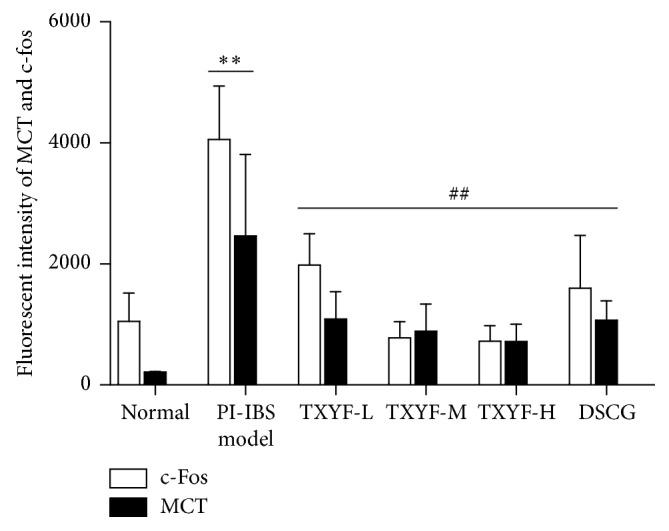
The fluorescent intensity of MCT and c-Fos in control and treated groups. Mean ± SD. n = 3. ∗∗P < 0.01 versus normal; ##P < 0.01 versus model.

The fluorescent intensity of MCT and c-Fos in control and treated groups. Mean ± SD. n = 3. ∗∗P < 0.01 versus normal; ##P < 0.01 versus model.