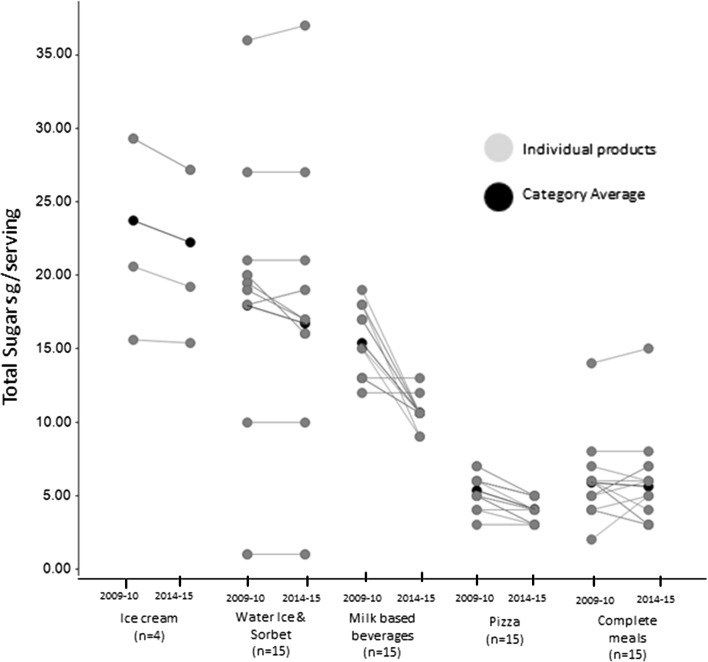
Fig. 2.
Changes in content per serving for total sugars shown for each individual product (grey) and the product category average (black). N represents the number of unique products and not the number of unique recipes. In the figure, points for unique products with similar nutrient profiles are superposed. Also products might have similar content for a given nutrient despite being derived by a different recipe and those are again superposed. Center of plate foods describes all the food items that are the main protein carrier of the meal, including fish and meat products as well as plant-based protein sources (like pulses) in the case of vegetarian meals

