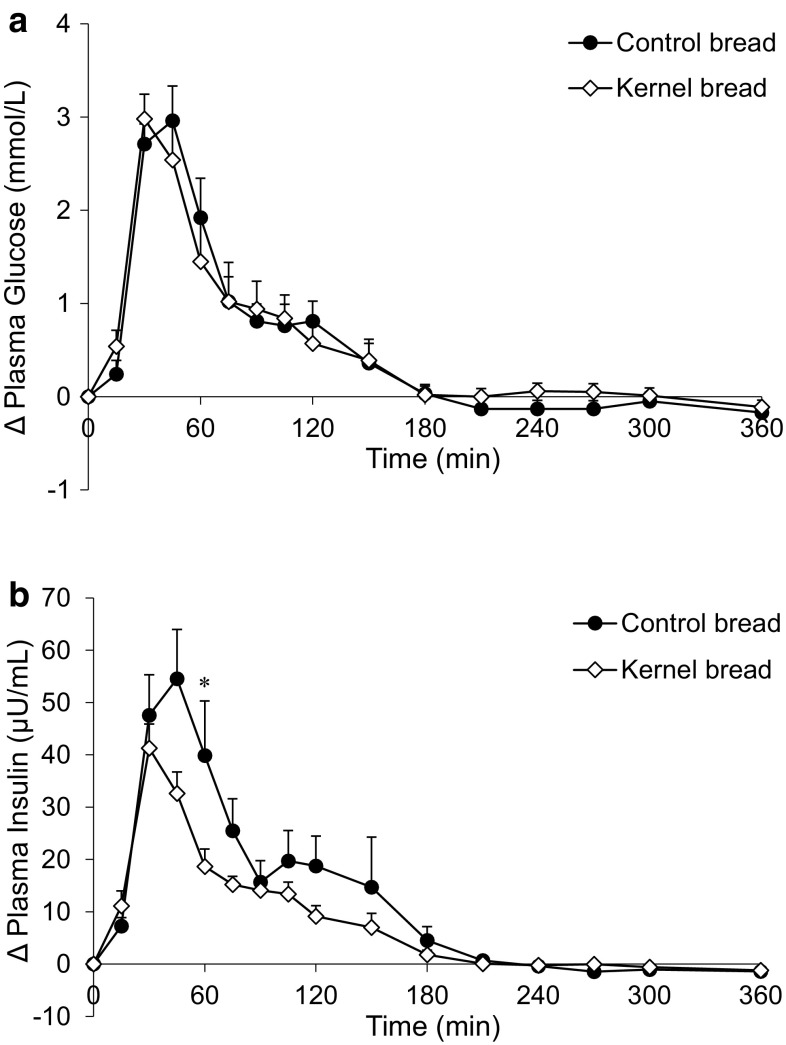
Fig. 3.
Mean (±SEM) changes from baseline in a plasma glucose concentrations and b plasma insulin concentrations, after ingestion of 138 g 13C-enriched control bread (filled circle) and 137 g 13C-enriched kernel bread (open diamond) in healthy men (n = 10). There was no significant time × treatment interaction for glucose (P = 0.1773), but there was for insulin (P < 0.0001). Asterisk significantly different between treatments per time point (after Benjamini–Hochberg correction)

