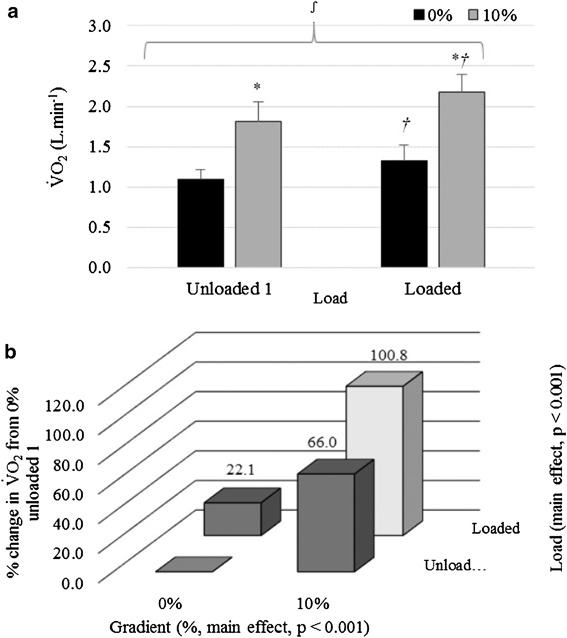
Fig. 2.

Mean ± SD V̇O2 (L · min−1) responses for Unloaded 1 and Loaded at 0 and 10% gradient averaged across all ambient temperatures. Asterisk denotes a significant difference to 0% responses for the same load, dagger denotes a significant difference to unloaded responses for the same gradient, and integral symbol denotes an interaction effect for gradient × load. b Interaction showing mean percentage change in V̇O2 (L · min−1) from 0% gradient, unloaded 1, averaged across all ambient temperatures
