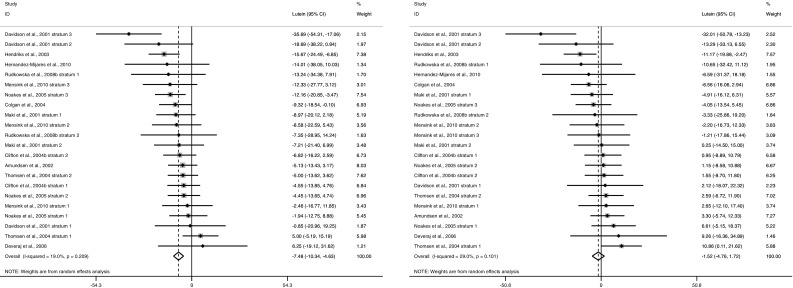
Fig. 3.

Forest plot relative change (expressed as summary estimates and 95 % CIs) in non-standardized (left panel) and TC-standardized (right panel) plasma lutein concentrations. The solid squares represent the weight of individual study arms, and the pooled effect estimate is represented as a diamond. Heterogeneity is assessed using Cochran’s Q test (P < 0.1 indicates significant heterogeneity) and quantified by I2, where >50 % indicates substantial heterogeneity
