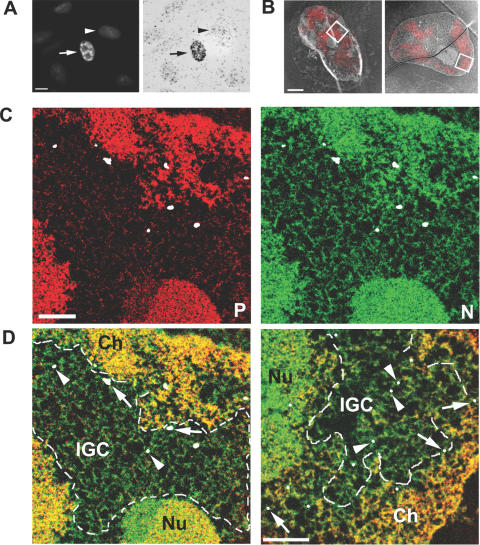
Figure 4.
Correlative light and electron spectroscopic imaging (LM/ESI) of SK-N-SH cells expressing LacI-tagged SC35 using fluorogold dsDNA oligos. Detection of nuclear speckles (arrow) via the Cy3 fluorophore (A, left panel), and confirmation of gold conjugation to the dsDNA oligo through silver enhancement (A, right panel). Untransfected cells (arrowhead) contain background levels of silver deposition. Scale bar = 200 nm. (B) Overlay of fluorescence and low magnification ESI micrographs collected at 155 eV. With two rounds of the silver enhancement using a LM enhancement kit (B, left panel), the silver particles are visible as bright spots. The right panel is an overlay image of a nucleus containing EM-enhanced gold. Scale bar = 2 μm. An area corresponding to an IGC, as defined by a box in the left panel is analysed at high resolution, and maps of phosphorus (C, red panel) and nitrogen (C, green panel) show the ultrastructure of the IGC region, which is low in phosphorus content and contains protein-based fibrous structures. The fluorogold oligo localization is indicated with silver-enhanced gold particles false-coloured in white. The composite map (D, left panel) illustrates the position of the IGC relative to chromatin (Ch, yellow) and the nucleolus (Nu, yellow-green). The silver particles in the interior of the IGC are labelled with arrowheads, whereas those proximal to the neighbouring chromatin are indicated by arrows. The composite map (D, right panel) of the EM-enhanced nucleus (B, right panel) contains smaller but uniform silver particles, as indicated by the arrows and arrowheads. Scale bar = 5 μm.

