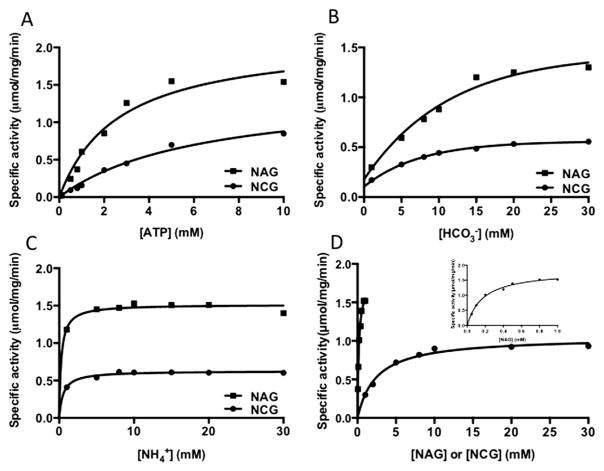
Fig. 2.
Comparison of biochemical properties of wild-type mouse CPS1 in the presence of NAG (1.0 mM) or NCG (10.0 mM). (A–C) Dependence of reaction velocity on the concentration of each substrate, ATP, bicarbonate and ammonium, respectively in the presence of NAG (square spots) or NCG (circle spots). (D) Dependence of reaction velocity on the concentration of NAG (square spots) and NCG (circle spots), illustrating their different affinity and maximum velocity. The inset is the enlargement of NAG titration curve.

