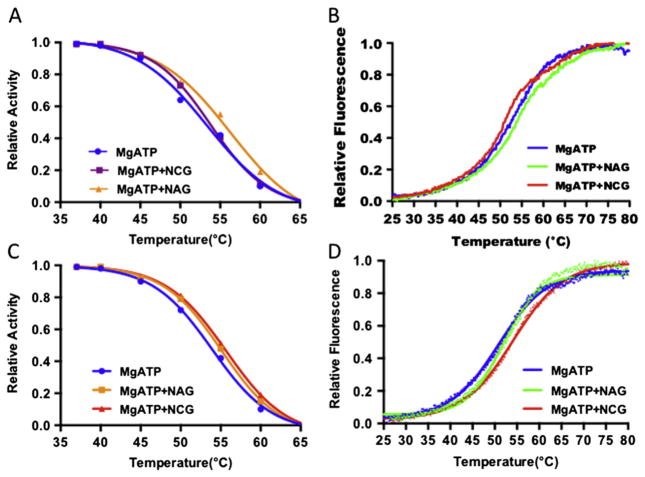
Fig. 4.
Thermal stability of wild-type CPS1 and E1034G mutant. (A) Remaining relative enzyme activity after incubation for 15 min at the indicated temperature for wild-type CPS1 in presence of MgATP (blue curve), MgATP + NAG (yellow curve) or MgATP + NCG (purple curve). (B) Relative fluorescence for wild-type CPS1 in presence of MgATP (blue curve), MgATP + NAG (green curve) or MgATP + NCG (brown curve) when temperature ramps from 298 K to 353 K. (C) Remaining relative enzyme activity after incubation for 15 min at the indicated temperature for the E1034G mutant in presence of MgATP (blue curve), MgATP + NAG (yellow curve) or MgATP + NCG (brown curve). (D) Relative fluorescence for the E1034G mutant in presence of MgATP (blue curve), MgATP + NAG (green curve) or MgATP + NCG (brown curve) when temperature ramps from 298 K to 353 K.

