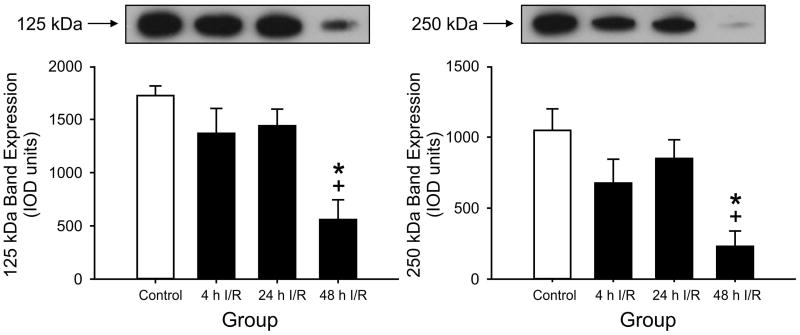
Figure 5.
125 kDa PaI and 250 kDa IaI expression plotted as arbitrary OD units in CSF for the control, 4 h, 24 h and 48 h I/R groups. 125 kDa PaI and 250 kDa PaI: Expression is lower at 48 h of I/R than in the 4 h and 24 h I/R groups, *P<0.05 the control group, +P<0.05 versus the 4 h and 24 h I/R groups. Values are mean ± SEM.

