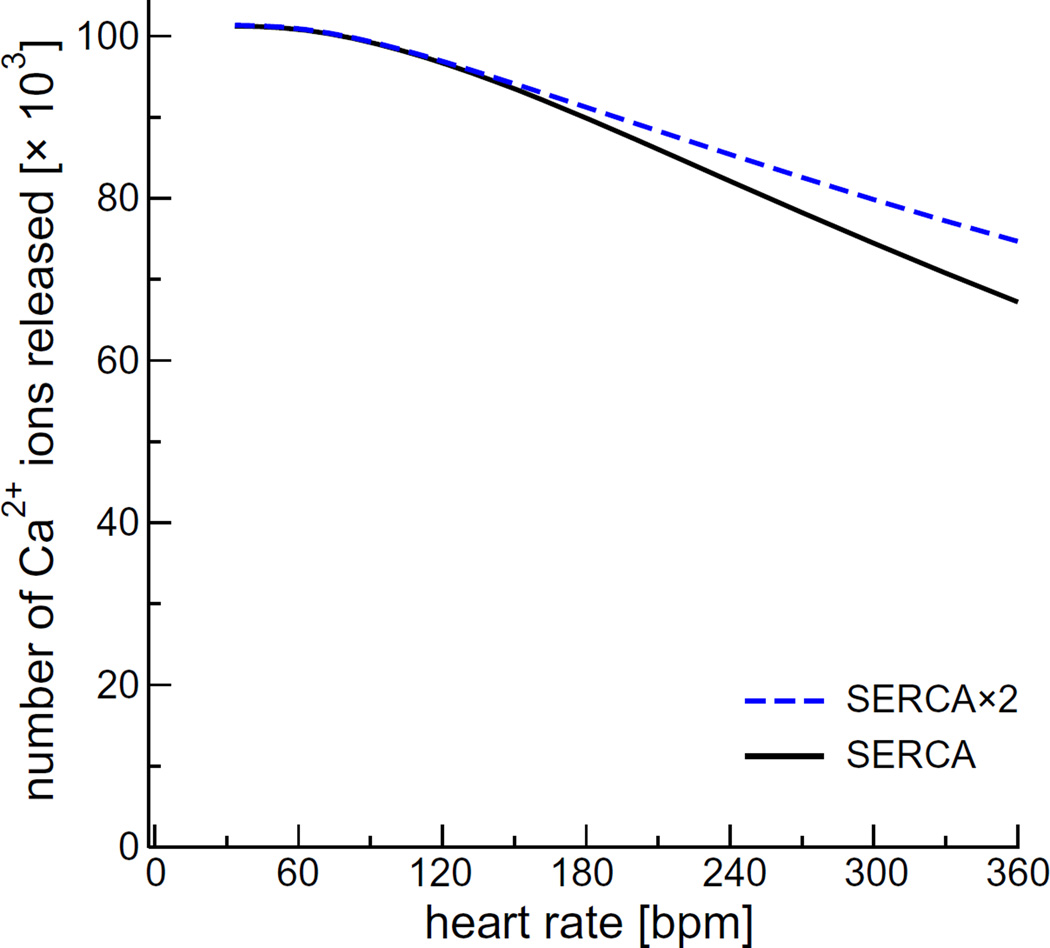
Fig. 4.
The number of Ca2+ ions released by a CRU during one heartbeat as a function of pacing rate for the regular SERCA model [9] (solid black line) and the phospholamban-enhanced model with twice the pumping rate (dashed blue line). (For interpretation of the references to color in this figure legend, the reader is referred to the web version of this article.)

