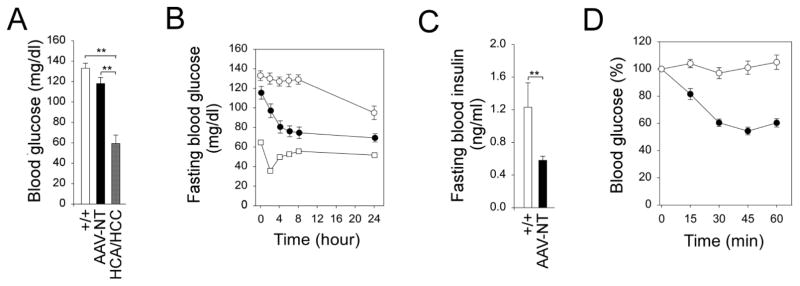
Fig. 2.
Phenotype, fasting blood glucose profile and insulin tolerance profile of 66–88 week-old wild-type and rAAV-treated G6pc−/− mice. (A) Blood glucose levels in wild-type (+/+, n = 12), AAV-NT (n = 22), and HCA/HCC-bearing (n = 3) mice. (B) Fasting blood glucose profiles in wild-type (○, n = 12), AAV-NT (●, n = 20) mice, and a single HCA-bearing mouse (□). (C) Twenty-four hour fasted blood insulin levels in wild-type (+/+, n = 12) and AAV-NT (n = 22) mice. (D) Insulin tolerance profiles of wild-type (○, n = 12) and AAV-NT (●, n = 20) mice. Values are reported as a percent of respective level of each group at zero time. Data represent the mean ± SEM; **P < 0.005.

