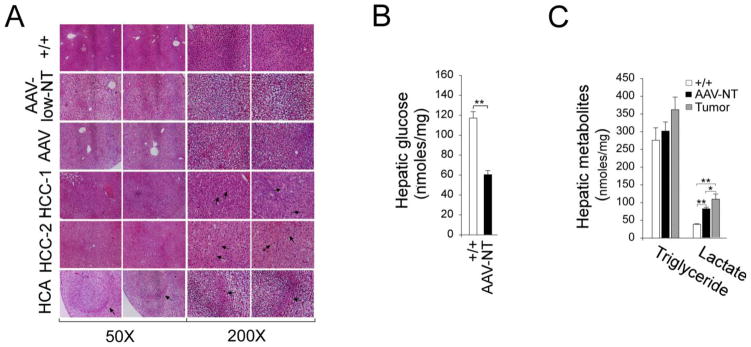
Fig. 3.
Histological analysis and hepatic metabolites in 66–88 week-old wild-type, rAAV-treated G6pc−/− mice, and HCA/HCC lesions. The data were analyzed for wild-type (+/+, n = 12), AAV-NT (n = 22), and the single HCA-bearing mice after 24 hours of fasting. The 2 HCC-bearing mice did not undergo fasting. (A) H&E stained liver sections. In HCA-bearing liver, the HCA lesion is denoted by arrows. In HCC-1 and HCC-2, arrows denote anisocytotic and anisokaryotic hepatocytes. Scale bar: 200 μm. (B) Hepatic glucose levels. (C) Hepatic triglyceride and lactate levels. Data represent the mean ± SEM; **P < 0.005.

