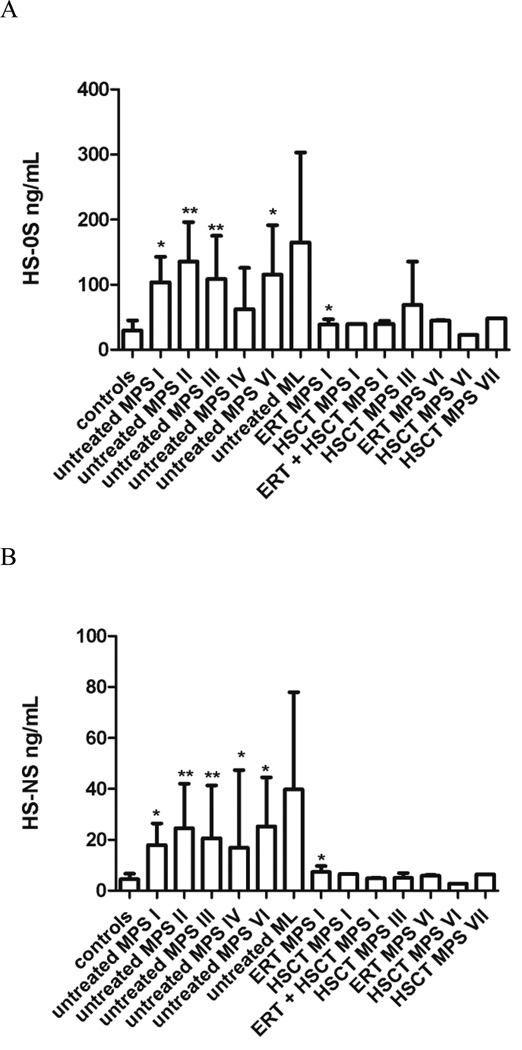
Figure 2. Heparan sulfate (HS-NS and HS-0S) levels in treated vs. untreated patients.
Untreated patients were compared with controls; treated patients were compared with untreated. A shows levels of HS-NS and B shows levels of HS-0S as mean and standard deviation. Values that were significantly increased in untreated patients or decreased by treatment are marked *p < 0.05; **p < 0.001

