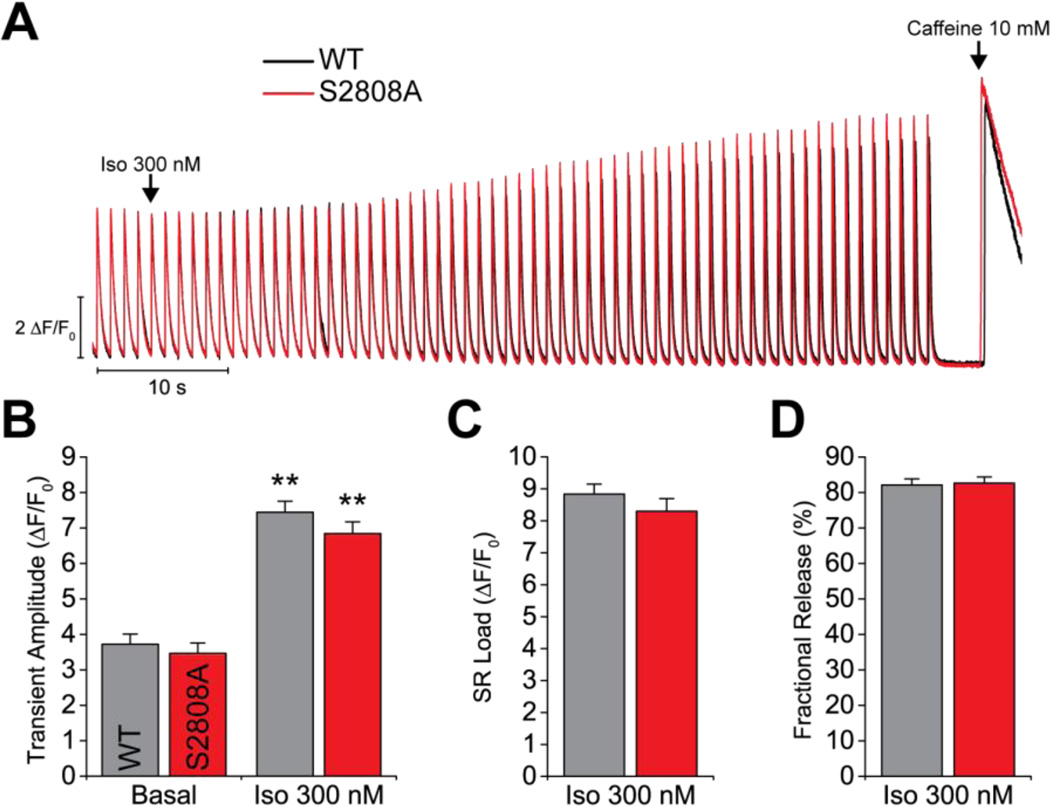
Figure 6. Ca2+ transients and SR Ca2+ load.
A. Representative traces of field stimulation-triggered Ca2+ transients. After obtaining a stable basal response, Iso 300 nM was perfused for 1 min, followed by a pulse of 10 mM caffeine to measure the SR Ca2+ load. B. Quantification of Ca2+ transient amplitude at basal conditions and with Iso stimulation. Both groups showed a significant response to Iso. C–D. Quantification of the SR Ca2+ load and fractional release (Ca2+ transient amplitude/SR Ca2+ load) under Iso stimulation. (N = 2 WT, 3 S2808A; n = 16 cells per genotype; ** p < 0.01 vs. same genotype basal).

