
Figure 1.
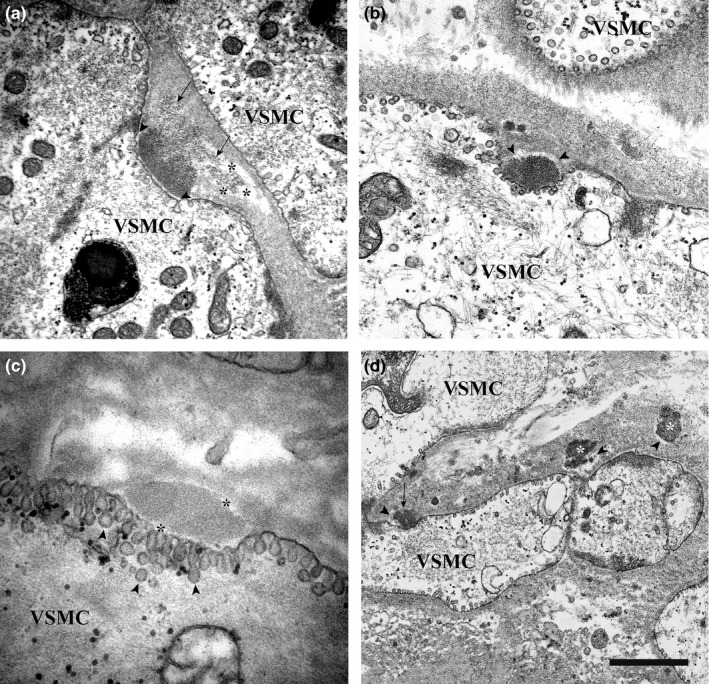
Transmission electron microscopic images of skin and renal biopsies from GOM‐positive patients. (a) Skin biopsy (patient #2). GOM in an infolding of a VSMC is separated from the cell membrane by a thin electron‐lucent halo (arrowheads). Note, the inhomogeneous density of the GOM: the inner side is denser and has a smooth profile, the interstitial side (arrows) is less osmiophilic, looser, and shows an irregular profile. The right portion of the less osmiophilic area is surrounded by an electron‐lucent halo (asterisks). (b) Renal biopsy (patient #4). GOM in an infolding of a VSMC. An electron‐lucent halo (arrowheads) separates it from the interstitium (from Figure 3 of Ragno et al., 2012) (permission granted by the Publisher). (c) Skin biopsy (patient #12). GOM in an infolding of a VSMC. The deposit is completely surrounded by an electron‐lucent halo (asterisks). Numerous pinocytotic vesicles (arrowheads) are clearly evident in proximity to the GOM deposit. (d) Renal biopsy (patient #4). Three GOM deposits: one is in close contact with a VSMC (arrow), the other two are free in the interstitium (asterisks). All three deposits are partially surrounded by an electron‐lucent halo (arrowheads). Scale bar: a, 840 nm; b, 600 nm; c, 370 nm; d, 1.6 μm.