
Figure 3.
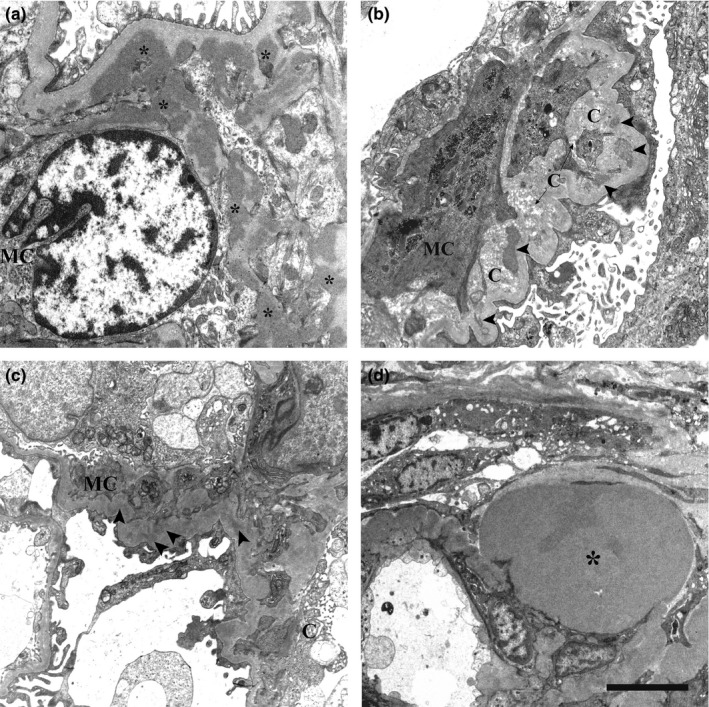
Transmission electron microscopic images of renal biopsies. (a) IgA nephropathy. Several electron‐dense mesangial deposits (asterisks) are shown. They lack the electron‐lucent halo. (b) Chronic IgA nephropathy. Mesangial deposits with varying degrees of resorption (arrowheads) close to collagen fibers are evident. Around them, the electron‐lucent halo is not detectable. (c) FSGS. Small electron‐dense IgM deposits in the mesangium are not surrounded by the electron‐lucent halo (arrowheads). (d) FSGS. A large electron‐dense hyaline material (asterisk) in paramesangial position is shown. The electron‐lucent halo is not visible. MC, mesangial cell. C, collagen fibers. Scale bar: a, 2 μm; b, 750 nm; c, 2.5 μm; d, 1 μm.