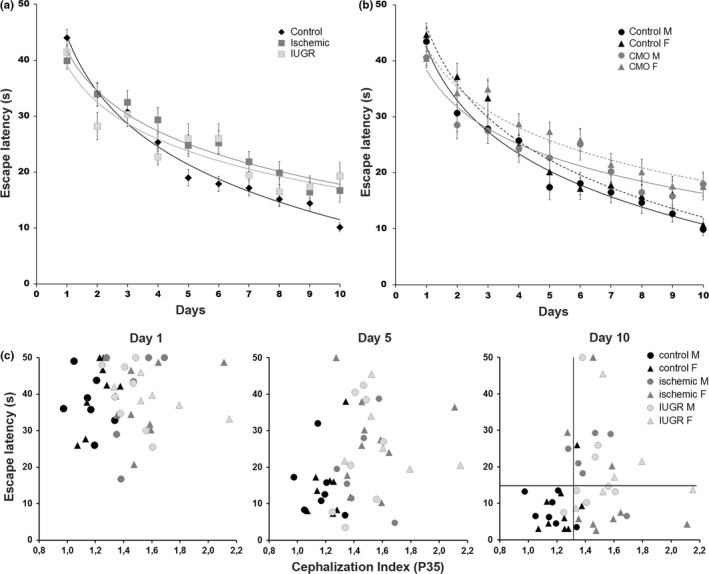
Figure 2.

Learning progression and correlation between escape latency and the cephalization index (CI). (a) Plot representing the average escape latency in four trials performed each day by the controls and the ischemic and Intrauterine growth restriction (IUGR) groups (n = 55, n = 34, N = 22, respectively, with similar representation of both genders) during the 10 days of the study. Learning progression fit to logarithmic curves and ANOVA analysis revealed significant differences in the shape of the curve and the final scores between the controls and the IUGR and ischemic rats (p < .001), with no significant differences between IUGR and ischemic rats. (b) Plot representing the average escape latency for the same animals as in (a), but segregated by gender and distributed into controls and CMO (IUGR + ischemic) experimental groups. Multifactor ANOVA and LSD analysis revealed significant differences in the shape of the learning curves between males and females (p < .01 LSD test), and between their corresponding controls and CMO groups (males p < .05, females p < .01, LSD test). (c) Dispersion plots represent the average escape latency of each individual (control male = 7, control female = 9; ischemic male = 6; ischemic female = 9; IUGR male = 8; IUGR female = 6) with respect to its CI on three representative days of the study. Vertical and horizontal lines on day 10 indicate the 75th percentile of the controls (CI = 1.32; escape latency [EL] = 17.7 s). Error bars in a and b represent the standard error of the mean
