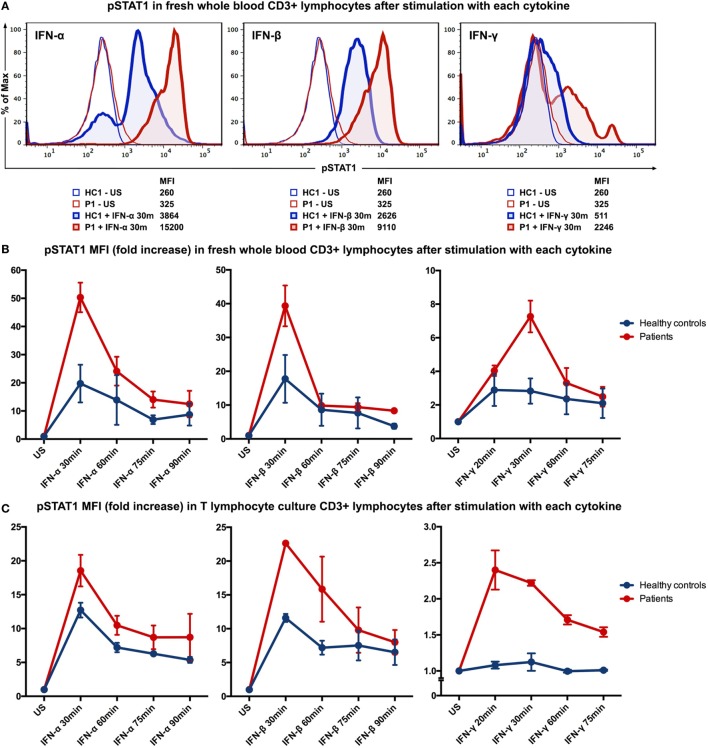
Figure 2.
STAT1 phosphorylation evaluated by intracellular staining flow cytometry after stimulation with IFN-α, IFN-β, or IFN-γ. (A) Histograms showing MFI of phosphorylated STAT1 (pSTAT1) in CD3+ T lymphocytes (in fresh whole blood) of patient P1 and healthy control (HC1) after stimulation with IFN-α, IFN-β or IFN-γ for 30 min. (B) Kinetics of STAT1 phosphorylation in CD3+ T lymphocytes (in fresh whole blood) of the two patients and two healthy controls after stimulation with IFN-α, IFN-β, or IFN-γ. (C) Kinetics of STAT1 phosphorylation in T lymphocyte cultures from both patients and healthy controls. HC, healthy control; P, patient; US, unstimulated; MFI, mean fluorescence intensity.

