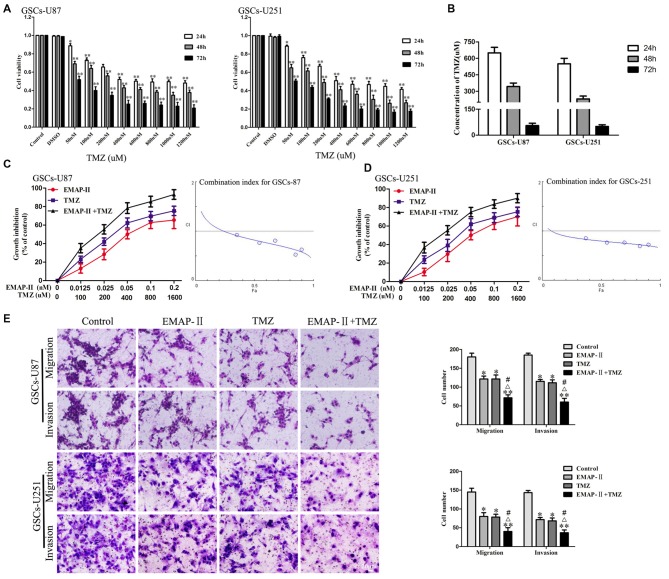
Figure 1.
Cytotoxic effect of temozolomide (TMZ) in glioblastoma stem cells (GSCs)-U87 and GSCs-U251. (A) GSCs were incubated with various concentration of TMZ (50–1200 μM) and cultured for 24 h, 48 h or 72 h. Cell counting kit-8 (CCK-8) assay were performed to detect the cell viability. Optical density (OD) value of cells was measured by a microplate reader at the wavelength of 450 nm, which was the indicator of cell viability. (B) The IC50 values of TMZ in GSCs-U87 and GSCs-U251. Effects of combination treatment with Endothelial-Monocyte-Activating Polypeptide-II (EMAP-II) and TMZ on the cell viability, migration and invasion of GSCs-U87 and GSCs-U251. (C,D) Cell viability was detected by CCK-8 assay. GSCs were treated with EMAP-II (0–0.2 nM) for 0.5 h and TMZ (0–1600 μM) for 48 h alone or in combination. The Fa-CI plot shows the combination index value (CI) for each fractional effect. The curves were generated using CompuSyn software. (E) Quantification of cell migration and invasion of GSCs after treated with EMAP-II (0.05 nM, 0.5 h), TMZ (400 μM, 48 h), or EMAP-II (0.05 nM, 0.5 h) + TMZ (400 μM, 48 h). Data are presented as the mean ± standard deviation (SD) (n = 5, each group). *P < 0.05 vs. Control group, **P < 0.01 vs. Control group, #P < 0.05 vs. EMAP-II group, ΔP < 0.05 vs. TMZ group.

