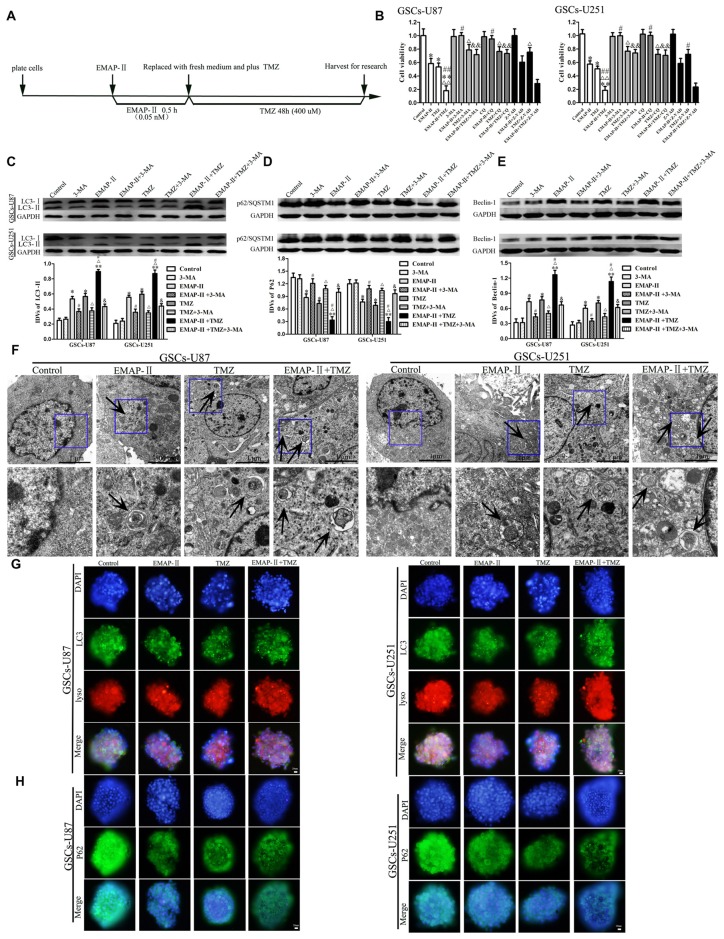
Figure 2.
Combination of EMAP-II with TMZ induced GSCs autophagy. (A) Timeline of the next combination treatment researches. (B) CCK-8 assay were performed to detect the cell viability of GSCs which were incubated with EMAP-II, TMZ or EMAP-II + TMZ and combined with 3-MA, chloroquine (CQ) or Z-VAD, respectively. OD value of cells was measured by a microplate reader at the wavelength of 450 nm. (C–E) Western blot analysis was performed to detect the expression of autophagy-related genes. (F) Electron microscopy showed ultrastructural features in GSCs treated with EMAP-II, TMZ or EMAP-II + TMZ. Arrows show autophagic vacuoles. (G) The colocalization of LC3 and LysoTracker Red in GSCs treated with EMAP-II, TMZ or EMAP-II + TMZ were observed by immunofluorescence assay. Pictures are respective magnification (n = 5, each). (H) The down-regulation of p62/SQSTM1 in GSCs were observed by immunofluorescence assay after treated with EMAP-II or TMZ or EMAP-II + TMZ. Data are presented as the mean ± SD (n = 5, each group) *P < 0.05 vs. Control group, **P < 0.01 vs. Control group, #P < 0.05 vs. EMAP-II group, ##P < 0.01 vs. EMAP-II group, ΔP < 0.05 vs. TMZ group, ΔΔP < 0.05 vs. TMZ group, &P < 0.05 vs. EMAP-II + TMZ group, &&P < 0.01 vs. EMAP-II + TMZ group.

