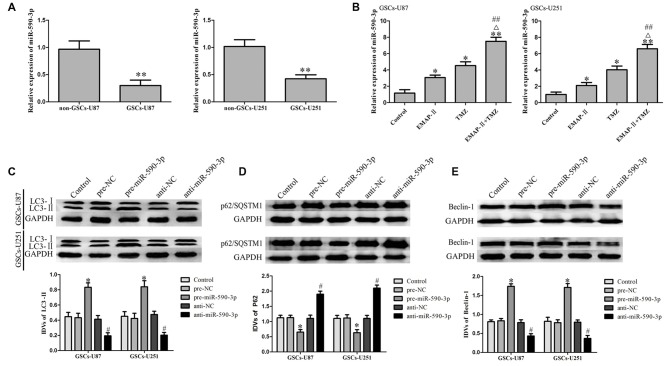
Figure 3.
MiR-590-3p expression in glioblastoma (GBM) cell lines and GSCs. (A) Expression of miR-590-3p in non-GSCs and GSCs. Data are presented as the mean ± SD (n = 5, each group) **P < 0.01 vs. non-GSCs group. (B) qRT-PCR analysis for the expression of miR-590-3p in GSCs treated with EMAP-II, TMZ or EMAP-II + TMZ. Data are presented as the mean ± SD (n = 5, each group) *P < 0.05 vs. Control group, **P < 0.01 vs. Control group, ##P < 0.01 vs. EMAP-II group, ΔP < 0.05 vs. TMZ group. Overexpression of miR-590-3p induced GSCs autophagy. (C–E) Western blot analysis was performed to detect the expression of autophagy-related genes. Data are presented as the mean ± SD (n = 5, each group) *P < 0.05 vs. pre-NC group, #P < 0.05 vs. anti-NC group.

