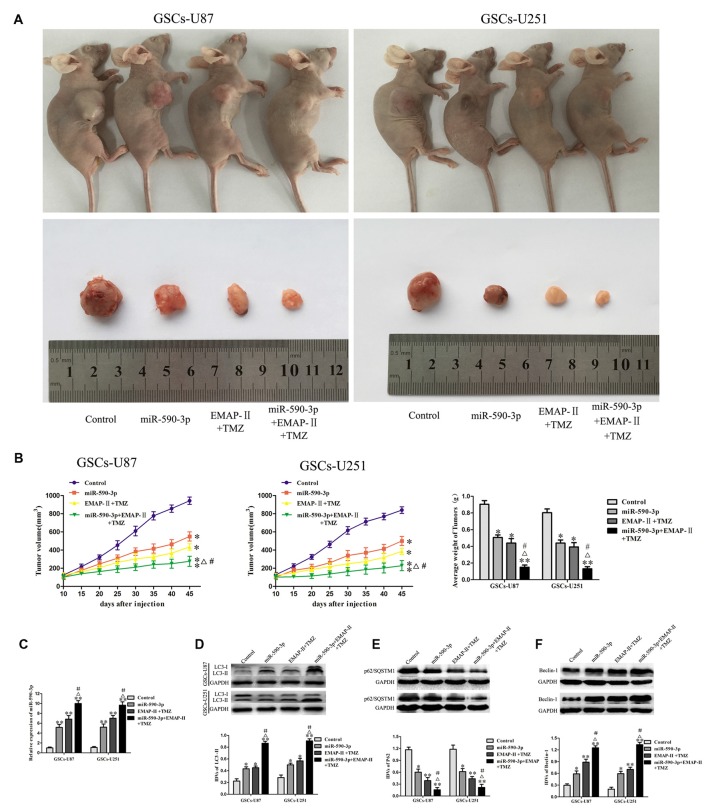
Figure 8.
Combination treatment with EMAP-II, TMZ and miR-590-3p suppressed tumor growth in vivo. (A) Representative images of mice and tumors removed from the xenografted mice were shown. (B) Tumor volume was recorded every 5 days, and the tumor was excised and weighed after 45 days. (C) qRT-PCR analysis for the expression of miR-590-3p in tumor tissues. (D–F) Western blot analysis was performed to detect the expression of autophagy-related genes in tumor tissues. Data are presented as the mean ± SD (n = 5, each group) *P < 0.05 vs. Control group, **P < 0.01 vs. Control group, #P < 0.05 vs. miR-590-3p group, ΔP < 0.05 vs. EMAP-II + TMZ group.

