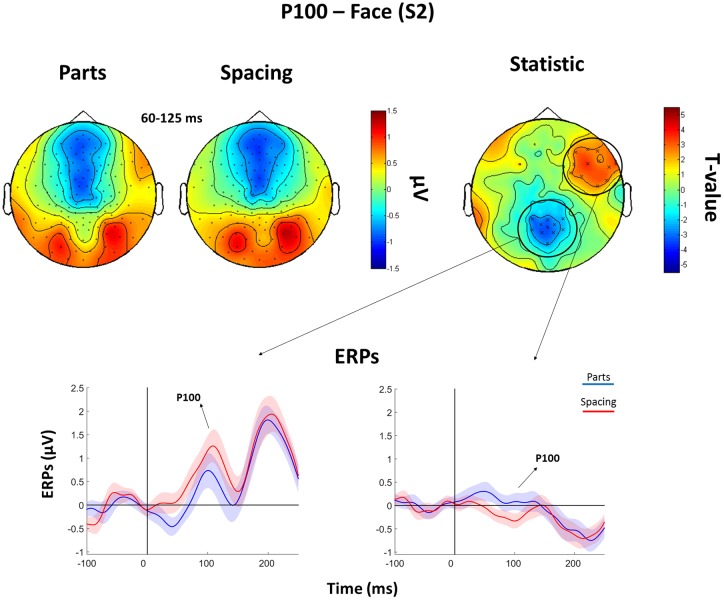
FIGURE 5.
Features (FP) vs. spacing (FS) contrasts for the P100 as elicited by S2 faces. Top: Topographical plots of grand-averaged ERPs for the two Face conditions (Parts and Spacing), t-statistic map distribution (X: p < 0.05). Bottom: Grand-averaged ERPs traces as averaged across statistically significant electrodes (shades represent the SEM).

