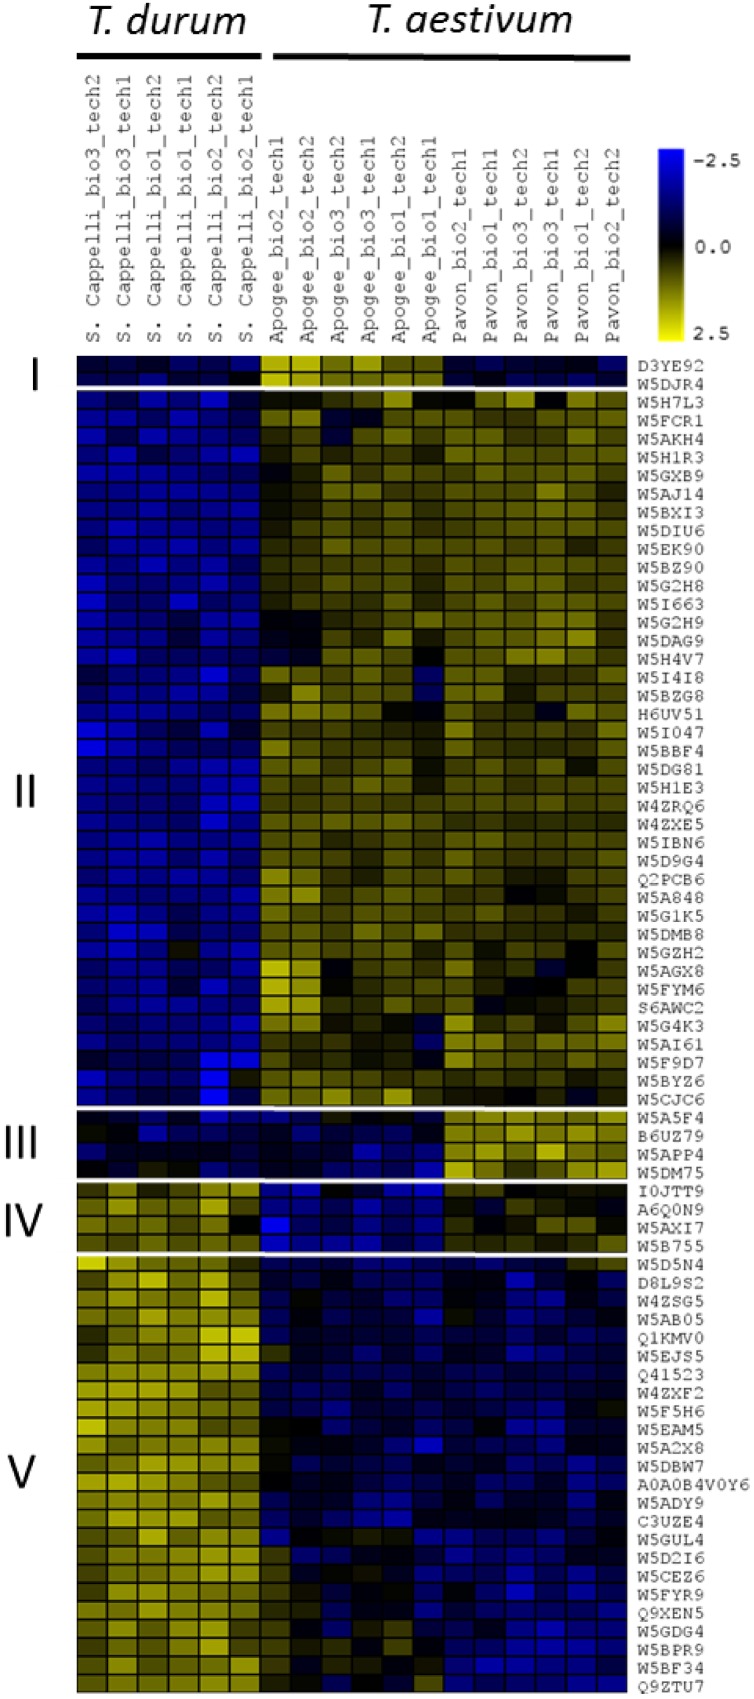
FIGURE 5.
Heat-map representing the proteins with significant different abundances in the technical replicates with the respective biological replicates of the wheat variants from the proteome analysis. Imputed Log2-Intensities of the proteins were Z-scored for the clustering. Wheat IDs are shown and protein description taken from the orthologs in Oryza sativa can be found in Supplementary Table S2.

