Figure 2.
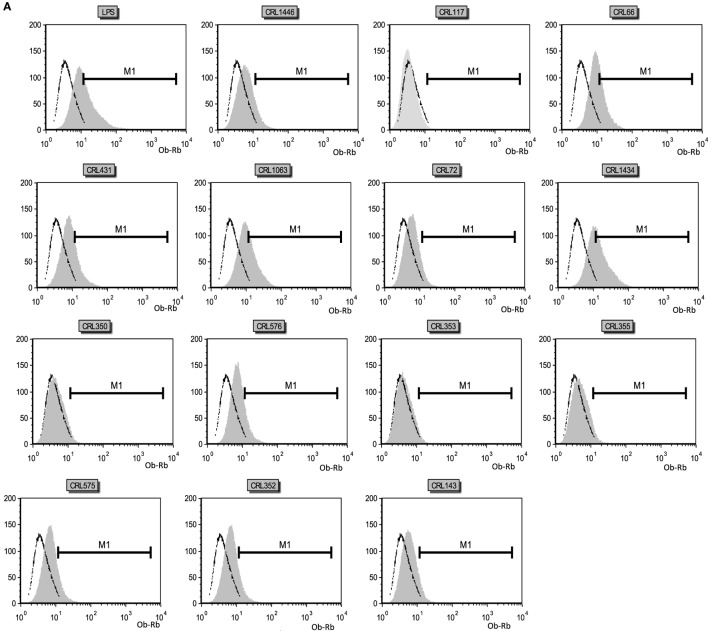
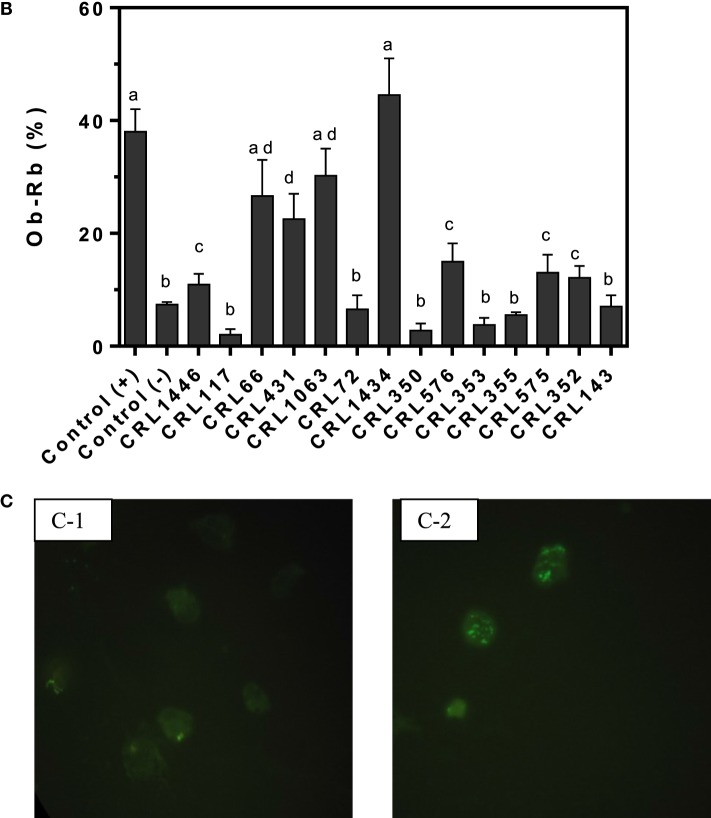
Leptin receptor (Ob-Rb) expression in RAW 264.7 cells. RAW 264.7 cells after lactic acid bacteria (LAB) stimulation were incubated with a polyclonal rabbit antimouse Ob-Rb Ab and a secondary FITC-conjugated Ab (antirabbit IgG). Ten thousand cells were analyzed per sample at an argon laser flow cytometry scanner. (A) Histograms correspond to the analysis of Ob-Rb expression by non-stimulated (negative control) and LAB-stimulated RAW 264.7 cells. The stimulating strains were CRL431, CRL258, CRL1063, CRL66, CRL72, CRL117, CRL1446 CRL1434, CRL350, CRL352, CRL353, CRL355, CRL575, and CRL576. Lipopolysaccharide (LPS) was used as a positive control. Open black line represents fluorescent labeling of Ob-Rb positive cells of negative control, and gray areas represent other strains stimulus. (B) Percentage of Ob-Rb expression in RAW 264.7 cells. The bars represent the different LAB strains. The results are expressed as media of percentages of cells Ob-Rb (+) ± SD of two experiments. Mean values in the same graphic with different letters (a–d) were significantly different (P < 0.05). (C) Microphotograph representative of the Ob-Rb expression in non-stimulated macrophages (negative control, C-1) and LPS-stimulated macrophages culture (positive control, C-2).


